Common adhesion test methods are fine for making comparisons, but are ill suited for making life-expectancy predictions. In the past, collecting the appropriate data for making durability predictions was very tedious.
The engineers at Adhesion Durability Instruments, Inc., have designed a machine that makes it much easier to obtain the necessary data for making durability predictions. This device, dubbed the Adhesion Durability Tester (ADT), measures crack propagation while simultaneously applying a mechanical load and an environmental stress. With this device and methodology, the formulator can generate data that can predict crack growth as a function of mechanical load and environmental stresses, such as heat, relative humidity, water immersion, solvents, ultraviolet radiation or acid rain.
Measuring the Durability of Adhesives
Commonly employed peel-test methods suffer from several deficiencies that make the results difficult or impossible to apply to the measurement of durability. One major problem is that the adhesion data is usually only measured at one testing speed. Yet, most adhesives are viscoelastic materials, and their strength is directly related to the testing speed and the temperature during the test. Therefore, it is necessary to measure the adhesive strength at several different test speeds or temperatures in order to characterize the rate dependence of the adhesive.It is also important to measure the adhesion over a range of crack speeds that are relevant to the actual application in the field. Crack speeds have to be very slow to simulate joints that have small stresses and must last for many years.
For example, if a weatherproofing sealant joint is 1/2-inch deep and is considered to have failed after one year when a crack has grown all the way through the joint, then the average crack speed for failure was less than 1/1,000,000th inches per minute! Keep in mind that some weatherproofing sealant joints last 10 years or more.
Another common problem with typical test methods is that the adhesive strength is measured at standard laboratory conditions. If environmental stresses are being studied, the joint is first exposed to the condition, and then the adhesion is tested. In the actual adhesive application, mechanical and environmental stresses are applied simultaneously, resulting in more rapid adhesive failure as compared to the sequential application of the two stresses.
The ADT is specifically designed for measuring the durability of adhesives that are exposed to small mechanical stresses in combination with environmental stresses over a period of many months or years. Sealants and elastomeric adhesives, coatings and pressure sensitive adhesives are examples of adhesive systems used in building and road construction, automotive, nautical, and aerospace applications that meet the above criteria. Medical implant devices and electrical potting compounds also fall into this category.
The ADT differs from typical testing machines in two important ways. First, the ADT applies a constant load to the peel specimen and measures the resulting crack growth. The crack growth is measured to the thousandth of an inch. Secondly, an environmental chamber contains the peel specimen so that severe environmental stresses can be applied while the peel test is ongoing. Some common environmental variables are temperature, humidity, solvent polarity, water pH, ultraviolet light and salinity. Measuring the crack growth as a function of mechanical load and one or more environmental stresses assesses the durability of the adhesive system.
Sufficient data can often be obtained in less than one week. Design engineers can then use this data to predict the performance of the adhesive system on different joint configurations if the state of stress and rate of stress are also defined.
|
|
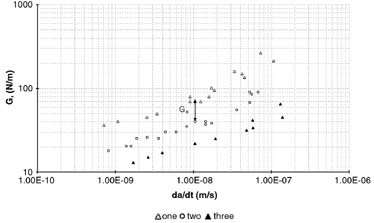
| Figure 1. Family of Curves |
Fracture Mechanics
Fracture mechanics can be described as the study of the growth of flaws or cracks in a macroscopically homogeneous material. A key assumption is that there will always be some type of defect in the joint that is a catalyst for failure.Bubbles in the adhesive, insufficient adhesive wet-out and poor workmanship can lead to obvious flaws in the joint. Fingerprints, poorly dispersed filler, dirty surfaces and improperly mixed adhesives are also significant, but subtle, flaws that are not part of the original joint design. A durable joint will be able to resist the growth of such preexisting cracks.
The energy needed to propagate a crack is called the strain-energy release rate, G, measured in energy per unit area, J/m2 = N/m. G is also called the fracture energy.
The measured value of G is composed of two parts. The first component of G is the contribution from the strength of the interface, commonly known as the intrinsic fracture energy, Go, which does not change with test speed. The second component of G is the contribution from dissipation and inertia. The size of the second component is many times larger than Go and more importantly varies greatly with the speed of the measurement. The following equation is often used to describe how the two contributions to G are related to the actual measurement, where G is the strain energy release rate and f is a dissipation function that is dependent on the temperature, the crack speed and the average strain of the polymer:
(1) G=Go(1+f)
(2) logG=logG+log(1+f)
At constant temperature and strain, f is a function of rate only. Equation 2 decouples the surface effects from the bulk effects. Changes measured as a function of surface changes will yield a series of curves that can be superimposed on each other by vertical shifting when plotted on a log-log graph of rate vs. strain energy as seen in Figure 1.
|
|
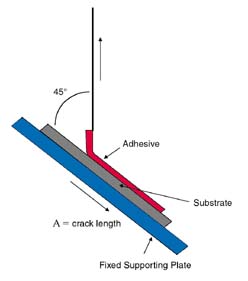
| Figure 2. Peel-Test Geometry |
(3) DlogG=logGo1+logf1–logGo2–logf2
The numerical subscripts on the right-hand side of Equation 3 represent different curves from the plot in Figure 1. The above relationship has been useful for peeling conditions that do not include changes in the dissipation term. If there are significant changes in the term f, then the curves will not be parallel and the relative difference between each curve will not be constant.
The fracture energy for the peel test is described by the following equation, where P is the load, w is the peel width and q is the peeling angle:
(4) G = P/w(1-cos q)
Equation 4 assumes no strain occurs in the detached strip after peeling. The geometry of a 45°-peel specimen can be seen in Figure 2.
|
|
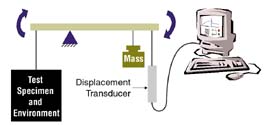
| Figure 3. The Basic Machine Concept |
Machine Basics
The accelerated adhesion durability test machine is custom designed for each durability application. The basic components of the machine can be seen in Figure 3.|
|
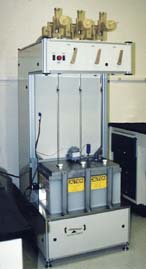
| Figure 4. ADT Configured With Immersion Bath |
By using load control, a force can be applied that is less than the tear strength of the adhesive, which minimizes cohesive failure and promotes interfacial failure. The interfacial fracture energy or adhesive durability is studied by applying an environmental stress, which induces adhesive failure. At measurements of high peel rates, such as those commonly employed using the 180°-peel test, the viscoelastic effects dominate, while at low peel rates, the viscous portion is minimized, which reveals the interfacial strength.
The accuracy of the ADT’s displacement transducers enables the measurement of crack speed to be as low as
10-9 m/s. Consistency and statistical accuracy are also enhanced because the failure mode is usually 100% adhesive.
|
|
| Figure 5. Peel Testing on SS Surfaces |
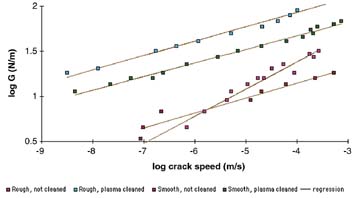
Some Examples
How clean should my substrates be? This is a common question that can be answered by adhesion testing. In this example, the adhesive is a bathtub caulk formulation. The substrate is stainless steel that has two levels of roughness and cleanliness.Peel testing was conducted while under water immersion at room temperature. The resulting data in Figure 5 easily indicate that a rougher and cleaner surface leads to better adhesion.1
In another example, the durability of a weatherproofing sealant joint was estimated as a function of exposure climate.2 First, the adhesion was measured as a function of applied fracture energy, temperature and relative humidity. The following rate equation was obtained from the fracture data, where da/dt is the crack speed, G is the fracture energy and the rest are constants obtained from the crack-speed curves:
|
|
| Figure 6. Crack Growth in Two Climates |
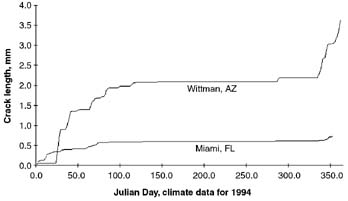
The data suggest that crack growth is highest during the winter months when the expansion joint is under tensile stresses and during times of high humidity. Historical data also agree with the results.
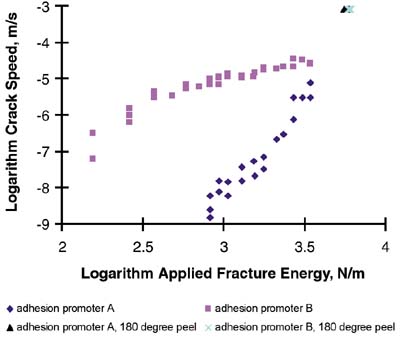
The ADT has also been used to evaluate two different adhesion promoters used in a sealant formulation.3 The adhesion was measured at ambient conditions.
|
|
| Figure 7. Comparison of Two Adhesion Promoters Using ASTM vs. ADT Measurement |
As described earlier, the ADT may be used as a research tool to fully investigate an adhesive-bond system. Master curves may be generated to span several decades of time as well as relate environmental effects, which are very useful for design engineers.
The ADT may also be used as a quick screening test once the test conditions for a particular adhesive system have been determined. Therefore, samples with differing substrates and lots of adhesive or cure conditions could easily and quickly be compared and screened at a single environmental condition and test rate. Referring to the data in Figure 7, good differentiation between the two sealants can be obtained with a single measurement for each specimen as long as the load is adjusted to give crack speeds less than 10-5 m/s.
Summary
The ADT is a new tool for measuring adhesion durability using a simple peel-test specimen that fills an unmet need for a fast adhesion measurement ideally suited for durability studies. The combination of constant applied load and environmental stress while measuring the crack speed is ideal for generating failure-rate equations for adhesive design. In addition, the measurement of crack speeds as low as 10-9m/s shortens the time needed to obtain long-term durability data. This specific methodology of applying a small load in combination with an environmental stress greatly increases the ability to discriminate slight differences in the strength of the interface and represents a unique change in durability testing.For more information on the ADT, please contact Adhesion Durability Instruments, Inc., 2333 Perrine Rd., Midland MI 48642; call 517 633 9576 or e-mail ADI@adhesion.net.