However, the uncured monomer is often highly reactive at ambient conditions, and, as such, manufacturing procedures must be properly regulated. For example, feedstock urethane resin must be kept frozen to suppress pre-cure and rapidly delivered to the mold to ensure optimal post-cure performance.
One manufacturer of medical devices uses a polyurethane sealant in a heat-exchange device often used during open-heart surgery. Because of the medical application, there is zero tolerance for failure of the sealant as this could result in biological contamination. The manufacturer was interested in the time-to-cure and the viscosity profile of the urethane as a function of time and/or temperature.
To improve production quality and product performance, the AR2000 advanced rheometer was used to monitor the curing profile of the urethane, aiding in the optimization and troubleshooting of the manufacturing process by monitoring the quality of incoming feedstock and optimizing production conditions.
Testing the Urethane
All rheological analyses were performed with the AR2000 Advanced Rheometer equipped with the Environmental Test Chamber (ETC). Because of the thermosetting nature of the material, 25-mm disposable plates were used as the test geometry. The urethane samples were supplied by the adhesives manufacturer and were analyzed under a flowing atmosphere of dry nitrogen.The urethane resin is supplied frozen in a large tube. During the manufacturing process, the tube is heated for ca. 30 min at 50 deg C in a warming oven to melt the resin, and then the tube is placed in a large pneumatic syringe for injection into the product. The product is then centrifuged to evenly disperse the urethane and finally baked under a proprietary set of conditions to finalize cure.
The viscosity of the urethane is monitored at room temperature after removal from the warming oven (modeling the transfer process), then under a slow temperature ramp and finally at 50 deg C (modeling the injection and centrifuge processes). Subsequent to these experiments, fresh samples are analyzed under oscillation to monitor the urethane cure during a controlled ramp from ambient to 100 deg C and an isothermal hold of 15 minutes.
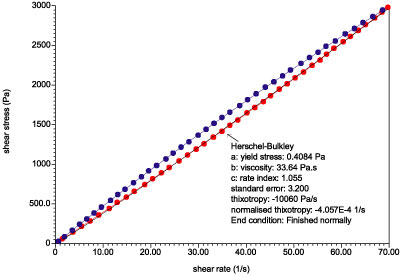
A sample of urethane is initially analyzed in a controlled-stress-flow (up/down) experiment at 25 deg C to determine the degree of thixotropy or shear thinning in the uncured resin. Figure 1 shows the results. It is clear from the data that the uncured urethane follows the Herschel-Bulkley flow model with minimal yield stress or shear thinning. It is assumed that the measured viscosity is negligibly dependent on shear stress. (The increase in viscosity on the "down" curve is most likely due to residual curing of the resin.)
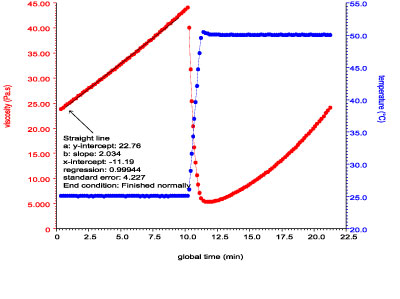
To model the viscosity profile of the resin as it is delivered into the mold, a series of samples were run under the following profile: The frozen sample is heated in a 50 deg C warming oven for ca. 30 min. An aliquot is removed and quickly placed on the measuring geometry at 25 deg C. The sample is placed under a steady shear stress of 1 kPa for 10 min at 25 deg C, and then heated at 25 deg C/min to 50 deg C, where it is held isothermally for an additional 15 min.
This heating profile is intended to model the temperature experienced by the sample during the injection and centrifuge stages of production. Figure 2 contains representative data collected during this test.
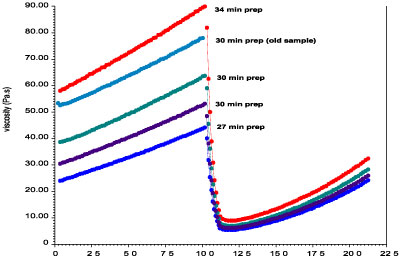
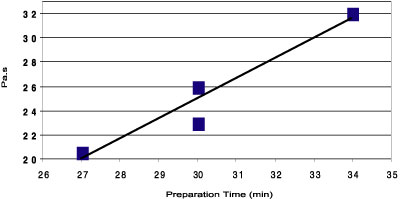
It is evident from the results of Figure 3 that the preparation time has a profound effect on the initial viscosity of the urethane. In addition, analysis of the slope of the viscosity increase during the initial isotherm suggests that the rate of the curing reaction is also a function of the preparation time. (See Figure 4.)
Impact of Rheology on Manufacturing
Understanding the rheology of the resin prior to injection and during the centrifuge process is paramount to optimizing the flow performance during this process. It is apparent that the handling time prior to injection greatly affects the viscosity of the urethane and will subsequently impact resin performance in the manufacturing cycle.In addition to flow performance, the curing times during the subsequent baking cycle are also of interest. The extent of cure can readily be monitored with an oscillation test. The relative magnitudes of storage modulus (G') and loss modulus (G") are good indicators of the rheological state of the material. When G" is greater in magnitude, the material is behaving more as a liquid. Conversely, if G' predominates, the material has more solid characteristics.
During a thermoset process, G" will initially predominate in the uncured resin. As the curing process proceeds, G' will increase at a faster rate than G" as structure is formed.
At some point, a "crossover" will occur, after which G' is predominant. This crossover point is often referred to as the "gel point" and empirically represents the "halfway" point between liquid and solid. The gel-point time (or temperature) is a useful parameter for monitoring the extent or rate of cure.
Effect of Prep Time on Curing Profile
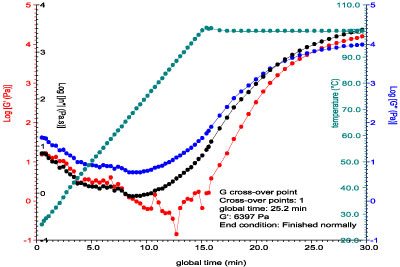
Figure 5 shows the rheological data from the curing profile. In this experiment, the urethane sample was warmed and transferred as before. The sample was analyzed under oscillation conditions of 0.1% strain at 1 Hz while heating at 5 deg C/min to 100 deg C. At this temperature, the strain was increased to 1.0%. G', G" and complex viscosity (m*) are monitored.The data in Figure 5 show a marked change in G', G" and m* as a function of temperature and time. G' increases nearly six orders of magnitude during this process.
The AR2000 rheometer is fully capable of accommodating this million-fold change in modulus as it utilizes both low-end sensitivity and high-end torque. The complex viscosity also undergoes a four order of magnitude change during the curing process.
The crossover point (gel time) is encountered at 25.3 min. Interestingly, on analyzing samples of varying preparation time, the gel time is consistently 25.3 min. This indicates that variance in preparation time does not affect the ultimate curing profile of the urethane.
Conclusions
The series of rheological tests on a urethane sealant show that manufacturing variances are associated with the initial viscosity of the uncured resin, and this was a function of preparation time. The curing time was not affected by the preparation time of the urethane resin.For additional information on the AR2000 rheometer, contact TA Instruments, Inc., 109 Lukens Drive, New Castle, DE 19720; phone 302-427-4000; fax 302-427-4001; e-mail info@tainst.com; or visit the Web site www.tainst.com. Or Circle No. 72.
