
"Cash for Clunkers" helped U.S. motor vehicle sales surge.
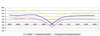
Figure 1. Global GDP Growth (Annual % Change)
While we at ChemQuest are currently updating our global adhesives reports with projected growth trends for the next five-year period, we are simultaneously compiling our annual outlook for the adhesives, sealants and coatings industries. The first step in that process is determining what macroeconomic changes are affecting regional economies and end-use demand.
By the end of 2009, the global economy had finally emerged from its worst economic recession since World War II. The synchronized economic downturn in 2008 is being followed by positive GDP growth throughout nearly all economies, albeit at vastly different rates. Figure 1 shows the abrupt downturn in both advanced and emerging economies from 2008-2009 and the expectation of continued growth, though at slightly lower rates. China and India were able to avoid year-over-year declines in their GDP in 2009 and, along with Brazil, are poised for the strongest growth rates in 2010. The recovery in Europe is the most sluggish, barely emerging with positive growth at the end of 2009.
The United States is in the middle, with positive GDP growth rates heading into 2010. As of press time, the Q4 2009 annualized GDP is expected to be 4.5% for the U.S., but there are worries about the sustainability of future growth. Much of the rebound in growth is attributable to inventory adjustments, as firms restock inventory that was liquidated during the downturn. Another factor adding to GDP growth is the large amount of government spending, which is expected to decrease in the second half of 2010.
Other, less-positive factors in future GDP are the continued struggles in residential and commercial construction. Total U.S. construction in 2009 was down 15% compared to 2008. However, while new-home sales appear to have bottomed out in January 2009, they have yet to break out from the bottom. With uncertainty surrounding the labor market, and the Federal Reserve expected to end its support for the mortgage bond market, it is unlikely that construction will substantially rebound in 2010, but it is not expected to deteriorate further.
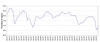
Figure 2a. Capacity Utilization - Manufacturing
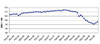
Figure 2b. Industrial Production Index (seasonally adjusted)
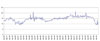
Figure 3. U.S. Lightweight Auto/Truck Sales (SAAR) (million of units)

Table.
For more information, phone (513) 469-7555 or visit www.chemquest.com.
Source of Figure 1: IMF
Source of Figures 2a, 2b and 3: Federal Reserve


