Controlled stress rheometers with cone/plate or plate/plate geometry are ideally suited for a variety of adhesive measurements. They also have the capability to apply a defined shear rate to the adhesive material. These instruments can operate in either controlled stress mode for yield stress, creep and recovery tests, or at a controlled rate for viscosity testing.
The following performance capabilities are important in a versatile controlled stress instrument for running a wide range of rheological tests:
- Controlled stress capability, with ramping up to several thousand Pascals
- Defined shear rate capability, with ramping up to several thousand reciprocal seconds
- Small sample volume on the order of 1-5 mL, depending on spindle geometry
- Fast, easy cleanup
- Wide temperature range, preferably from 0-200ºC
- Fast temperature change, possible when using peltier technology; instruments can change from ambient temperature to 100°C (or vice versa) in five minutes or less
- High torque range up to 50 mNm for measuring thick materials
- Spindle geometries with cones and plates of various diameters that allow measurement of viscosities from ~100 cP (100 mPa·s) to >15,000,000 cP (15,000 Pa·s)
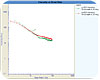
Figure 1. Viscosity vs. Shear Rate for Two Adhesives
Viscosity vs. Shear Rate for Two Adhesives
As shown in Figure 1, a simple speed ramp from 0 sec-1to 100 sec-1tests two variations of an adhesive. The adhesive indicated by the data shown in red performs well; the green, less so.Tests with a conventional viscometer at one speed produced similar viscosity values. The test with the rheometer over the shear rate range in the figure clearly shows that the green material, while near the red at low shear rates, thins and seems to become unstable at shear rates over 20 sec-1. If the adhesive is applied at fairly high shear rates, the green formulation will not work.
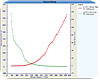
Figure 2. Shear Stress Ramp (Red) and Viscosity Profile (Green)
Shear Stress Ramp and Viscosity Profile
Yield stress (i.e., the point at which flow begins) can be an important property. Many consumer adhesives are supplied in tubes that the consumer squeezes the adhesive out of. If too much force is required to initiate flow, the product may not be acceptable to consumers. Using a controlled stress instrument, a simple stress ramp provides a precise yield stress value.In Figure 2, shear stress is ramped from 0 Pa to ~ 600 Pa over 60 seconds. Because the adhesive does not move until the yield stress is achieved, there is no shear rate (and hence viscosity) until yield takes place. The graph clearly shows that the yield stress value for this adhesive is ~ 50 Pa (see the curve in red), which is an acceptably low value.
In addition, this graph shows that the adhesive is pseudoplastic (i.e., exhibits decreasing viscosity with increasing shear rate), so the viscosity will decrease as the consumer squeezes the tube (see the curve in green). The consumer will not need to squeeze the tube with significant force, and the adhesive will be easily applied.
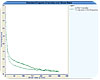
Figure 3. Viscosity vs. Shear Rate Up-Down Test to Assess Recovery
Viscosity vs. Shear Rate Up-Down Test
When the adhesive is supplied in a tube or container, force is required for application of the material. Viscosity recovery may be an issue. As force is applied and the shear rate increases, the viscosity will probably change (most commonly, it will decrease). After having been sheared, if the material does not recover to a fairly high viscosity, it may not “stay where it is put,” which can be a problem. A simple two-step flow curve, which only takes two minutes, assesses both the degree of shear thinning behavior and the recovery.The test program has two steps. In the first step, shear rate is ramped from 0 sec-1 to 300 sec-1; in step two, it is ramped from 300 sec-1to 0 sec-1. As is evident in Figure 3, viscosity in the first step drops dramatically from ~ 80 Pa·s (80,000 cP) at low shear rates to ~ 5 Pa·s (5,000 cP) at 300 sec-1. In the second step, some “interesting” behavior then begins at about 160 sec-1. Although the step-two viscosity values are less than the step-one values for any given shear rate, there is recovery and the final viscosity reading of ~ 52 Pa·s (52,000 cP) will be high enough for the adhesive to stay where it is applied.
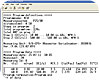
Figure 4. Two-Point QC Test
Two-Point QC Test
While viscosity data taken over multiple rotational speeds provides more information about the fluid flow properties, a quick QC test can be accomplished with two data points: one at high shear rate and the other at a low shear rate. To further simplify the test procedure, this type of test can be done without PC control (though using a printer is recommended).In Figure 4, viscosity readings are taken at 10 sec-1and 500 sec-1. The printed output displays viscosity under the term “Eta” and the two values noted are 15.410 Pa·s and 1.279 Pa·s, respectively. This clearly indicates a significant degree of shear thinning behavior, which is desirable for good adhesive performance when in use. Note that all measured values are printed, as well as instrument and program information.
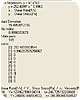
Figure 5. Math Model Analysis of Viscosity Data Using the Oswald Regression
Math Model Analysis of Viscosity Data Using the Ostwald Regression
When a controlled stress rheometer is under software control, the ability to apply a regression analysis to the test data offers a significant opportunity to analyze the data quickly and effectively. With good correlation, this allows the estimation of viscosity values at untested shear rates.Figure 5 shows the Ostwald (power law) regression for a nearly Newtonian fluid having a viscosity of ~ 250 Pa·s (250,000 cP). It would take considerably more torque capability in an instrument to test the fluid at a shear rate of 1000 sec-1(a 30-hp rheometer would be quite expensive). Because the correlation to the Ostwald model is good (99.628, in this case), we can use the model to estimate the viscosity at 500 sec-1and 1,000 sec-1. The values were 246.725 Pa·s and 246.090 Pa·s, respectively, seen at the end of the results where stress and rate are also shown. The Ostwald n and k values are shown as constants 1 and 0; the n is 0.9962 while the k is 252.489 Pa·s.

Figure 6. Viscosity vs. Shear Rate for Highly Viscous Adhesive
Viscosity vs. Shear Rate for Highly Viscous Adhesive
Figure 6 shows the high viscosity capability of the controlled stress rheometer. The test was a simple stress ramp up to ~ 6,100 Pa using 25 mm flat plate geometry. Note that at low shear rates (below 1 sec-1), the viscosity was well over 1,000 Pa·s (1,000,000 cP). Testing fluids that are highly viscous at defined shear rates is nearly impossible with other moderately priced instruments.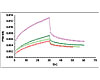
Figure 7. Vane Spindle Rotation vs. Time Measures "Stiffness"
Vane Spindle Rotation vs. Time Measures "Stiffness"
This application uses the vane spindle with a controlled stress rheometer. Vane spindles are useful for low shear measurement of very high-viscosity, near-solid materials. In this case, a heavy flooring adhesive served as the sample.The test includes two steps, using stress (or torque) as the control parameter. In step one, a constant stress or torque is applied. In step two, the stress/torque is removed. This provides a measurement of stiffness by plotting the movement of the vane (in radians) against time. Less stiff materials have more movement. By removing stress/torque in step two, it is possible to get an indication of the degree of elastic behavior; more elastic materials will pull the vane back toward the start point. In this example, the red, light green and green samples were acceptably stiff; the purple sample was not sufficiently rigid (see Figure 7).
Dual Capability
The examples presented here serve to provide a sense of a controlled stress rheometer’s capabilities. The important point to keep in mind is that this type of instrument operates in both controlled stress and controlled rate modes. When testing adhesive materials, this dual capability is vital to the range of necessary rheological tests. The shift to the use of controlled stress instrumentation is a logical step toward ensuring that R&D and QC labs operate at peak efficiency.For additional information, contact Brookfield Engineering Laboratories, Inc. at 11 Commerce Blvd., Middleboro, MA 02346; phone (800) 628-8139; fax (508) 946-6262; email the author at j_walters@brookfieldengineering.com; or visit www.brookfieldengineering.com.


