


Recovery within the adhesives and sealants industry appears increasingly favorable as the U.S. macro backdrop improves. For the first time since 2008, all six construction-related indices are pointing in the right direction—a good thing for both adhesives and sealants, as construction makes up over 40% of total consumption.
MARKET EXPECTATIONS
The construction recovery is expected to be gradual, with weather-related pull-forward occurring in the first quarter, and starts forecasted to remain below the 1 million mark through 2013. The new “normalized” level of housing starts is estimated at 1.15 million units.
While construction has stabilized, industrial production is up across most sectors; auto has picked up, and mining/oil/gas field machinery leads the pack. Public sector spending remains tight amid budget deficits, and private spending has yet to pick up enough to offset this weakness.
Margin outlook is stable and “good.” The cost structure for U.S. adhesive companies became slightly less favorable in 2011 relative to 2009. Within adhesives, raw material costs were 58% of sales, up from 56% in 2009, and gross margin of 32% is down a point. In 2012, adhesives and sealants sales are expected to be up 9% (5% by volume and 4% by price), supported by raw pass-through, but prices could lag raw materials, resulting in slight margin contraction.
Long-term, healthy and notable trends for adhesives and sealants exist, including improved construction standards, fuel efficiency, smart packaging, continued mechanical fastener replacement, and sustainability initiatives.
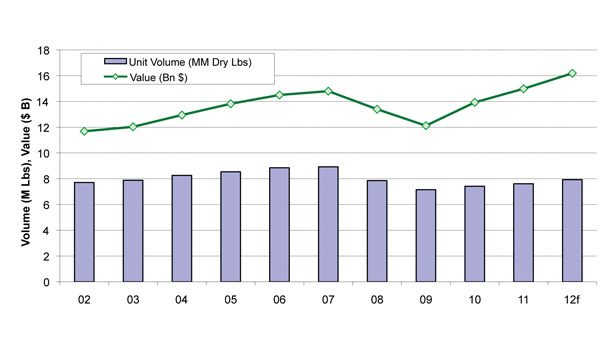
In 2011, the industry generated $15 billion in sales (adhesives accounted for about $13 billion and sealants about $2 billion, as seen in Figure 1), although the addressable market is estimated at $47 billion. Recovery from 2009 has been mainly driven by price increases, while volume gains have occurred at a more measured pace.
In 2008, the industry sales contracted $2.5 billion, due in large part to a 15% global decline in sealants sales, while adhesives slipped only 4%. Adhesives volume dropped 10% in 2008 and roughly 8% in 2009, while sealants volume was down more than 20% in 2008 and about 17% in 2009.
Demand is driven by five major end markets, as shown in Figure 2. By end market, the overall industry has greatest exposure to construction
(42% annual growth rate), followed by packaging (22% AGR), and transportation (11% AGR). Specifically for each product, sealants are largely driven by construction and transportation, while adhesives have a large exposure to packaging.
Industry margins remain stable (see Figure 3). Raw materials account for a majority of the cost structure at about 58% of sales. Since 2009, total cost of goods sold (COGS) have increased by a point to about 68% relative to 2005, largely due to raw material inflation.
Prices in adhesives have increased steadily since 2005 despite the recession (see Figure 4). In 2009, the continued pricing momentum, coupled with lower resin costs, helped margin expansion. However, since then, both price and cost have trended higher, resulting in margin compression.
In 2012, adhesives price and volume are both forecast to increase around 4% year over year, while sealants’ about 8.5% growth should be driven more by volume (forecasted up around 5% year over year). Together, ChemQuest estimates 4% higher price and 5% greater volume (or 9% value improvement), with price being pushed by higher raw material costs. Margins are stable as price increases catch up on the lag of the rise in raw materials.
DRIVING DEMAND
Several notable trends drive the adhesives and sealants markets. In construction, improved building standards are supporting demand. Using adhesives and sealants as a structural repair material for concrete is more cost effective, and project cycle time is shorter—highways and bridges can be reopened faster as repair time is condensed.
Adhesives are also more eco-friendly; for every ton of concrete produced, 1.4 tons of carbon dioxide is released. Figure 5 illustrates the greatest growth in construction, which was seen in the 2011 power market (up about 15% year over year), followed by commercial (about 8%).
Fuel efficiency is another driver. In transportation, U.S. manufacturers are following trends toward vehicle downsizing and light-weighting, which require producers to shed roughly 850 lbs per automobile. In order to meet these marks, manufacturers must replace metals with plastics, composites and lighter metals. These products cannot be put together with traditional mechanical fastening, instead requiring the use of adhesives. Figure 6 shows the expected penetration by 2015 of adhesives and sealants in vehicles. Trailers appear to have the greatest growth potential (about 140%), followed by SUVs/automobiles and trucks (both about 25%).
In conclusion, while the recovery has been slowly gaining momentum, the long-term prospects for growth for adhesives and sealants are tremendous, particularly in reactive/structural technologies and end uses. The industry’s balance sheet is significantly improved, leading to much better prospects for investment in product innovation and fueling the prospects for accelerated consolidation.
Editor's note: All figures in this article are courtesy of The ChemQuest Group Inc.
