On a daily basis, television, newspaper, and radio fill their programming with “experts” who are all too eager to prognosticate where the stock market will be in 12 months, how quickly the sea will rise in the next 100 years, or who will win the Super Bowl and why. One thing they have in common is that nearly all will be wrong—and by a large margin. Even the ones who “got it right” are usually not as accurate as they appear; a closer look shows that even the small-number predictions that seem to be correct are often only partially right. Research has shown that humans are terrible at dealing with and understanding uncertainty.
Despite an abysmal record of prediction, year after year people continue to listen to “experts” explain why their latest prediction will come true. In reality, it is confidence, factual knowledge and communicative ability that give rise to the popularity of experts, not their forecasting abilities. The proliferation of data available to use for forecast modeling hasn’t increased the reliability of forecasts all that much. Paradoxically, behavioral research has shown that more data can make prediction less reliable; it is more likely to lead to overconfidence than it is to increased accuracy.
Forecasting Errors and Alternatives
It is one thing to listen to predictions for entertainment, and another to make major decisions based on forecasts that turn out to be woefully incorrect. Whether a prediction by the Federal Reserve, the International Monetary Fund, the bond rating agencies, or an acquisition evaluation, forecasts of complex systems inevitably turn out to be incorrect. The real-world systems that humans are most interested in predicting are often nonlinear and dynamic in nature. Those two conditions can be too complex to model accurately, and errors in assumptions can and do lead to gigantic forecasting errors.
For example, the Congressional Budget Office issues annual 10-year baseline projections for federal spending and receipts. In January 2001, the forecast was for a cumulative surplus of $5.6 trillion for the years 2002-2011. However, the projected surplus over that period actually turned out to be a $6.1 trillion deficit, for a total variance of $11.7 trillion.
If it is next to impossible to model an accurate forecast of complex issues, what is the alternative? First and foremost, it is necessary to recalibrate how to think about forecasting. Learn to embrace and incorporate uncertainty into the forecasting process rather than accept the human tendency to provide “the answer.” At The ChemQuest Group, we have included this approach into our Decision & Risk Analysis (D&RA) Toolbox. It is what we use to aid decision making for considerable investment decisions with a high degree of complexity. Examples include major capital expenditures, potential acquisitions and new product development.
D&RA Toolbox
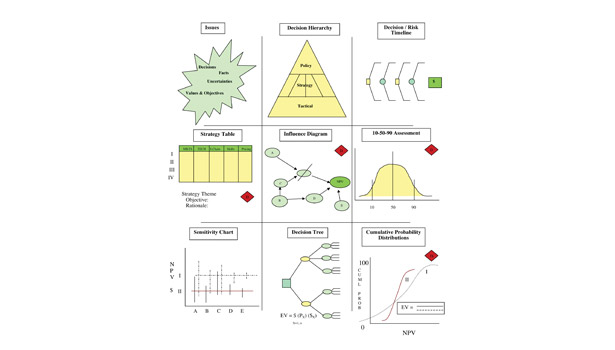
The toolbox contains nine tools (see Figure 1). The first three steps in the toolbox frame the problem. The framing stage raises important issues, creates a wide range of alternatives and provides the framework for analysis.
The next three steps quantify risks and uncertainties. One prevalent tool contained in these steps is the influence diagram. An influence diagram depicts relationships among all the variables and decisions that will ultimately impact the decision criteria. Another tool is the “10-50-90” analysis. It requires experts to assess the probabilities of impact that each variable has on uncertain events. At a 10% probability, the expert’s estimates reflect a one in 10 chance that the real value of the uncertainty will lag his/her assessment. At 90% probability, however, the expert’s estimates reflect a one in 10 chance that the real value of the uncertainty will exceed his/ her assessment.
The final three steps perform sensitivity analysis, generate a range of outcomes and apply the decision criteria. The sensitivity analysis shows precisely how decisions change as values and probabilities vary. The sensitivity analysis focuses the entire organization on those variables that have the greatest influence on the bottom line. It directs effort toward resolution of a small number of critical uncertainties responsible for a large percentage of total risk.
Another key decision-making tool is the decision tree. The decision tree defines the chronology in which decisions are made and integrates the entire analysis in a recommendation based on probability. Together, decision trees and influence diagrams can help decision-makers evaluate the range of possible strategies and scenarios to reach the best decision. The final step applies the decision criteria to the full range of probabilities to develop a risk profile. It plots the distribution of decision criteria, such as profitability, showing the probabilities associated with each profit level.
Other Methodologies
Our methodology is certainly not the only or necessarily best way to bring more robustness to decision making. The advent of excellent analytical tools, such as Palisade’s @RISK Monte Carlo simulation software, has made modeling complex decisions and probabilistic outcomes much easier and more prevalent in the corporate world. While the @RISK software allows an easy input of probability distributions for uncertainties, we still prefer to use the triangular distribution from our “10-50-90” analysis. It’s a time-consuming exercise, but it teaches participating groups (e.g., R&D, marketing, production) to critically reevaluate and recalibrate their assumptions about uncertainties, as well as to buy into the output of the final decision.
Incorporating a robust methodology to deal with uncertainty does not necessarily lead to accurate forecasting and optimal decision making. There will always be the unknown unknowns that former Secretary of Defense Donald Rumsfeld talked about: events that almost no one will see coming that dramatically affect the future and can’t be foreseen (i.e., black swans). However, by gaining a better understanding of the nature of uncertainty and incorporating it into the decision-making process, it is possible to do a better job with the known unknowns.
Any views or opinions expressed in this column are those of the author and do not represent those of ASI, its staff, Editorial Advisory Board or BNP Media.


