


Traditional quality control methods for viscosity measurement of adhesive and sealant materials focus on the single point test. Using a rotational viscometer with disc-type spindle or T-bar spindle (or perhaps even a cone/plate model), the technician runs the instrument at one speed, records the viscosity number, and verifies that it falls between maximum and minimum limits for acceptance. Failure requires a repeat of the test on a fresh sample or, if there is concern that the instrument might be the problem, a calibration check on the viscometer is performed with a viscosity standard fluid.
Increased capability designed into today’s generation of benchtop viscometers and rheometers has created opportunity for more comprehensive viscosity measurements in roughly the same amount of test time. Assessing how viscosity changes when the material is tested at different rotational speeds gives a complete picture of flow behavior. Low rotational speeds of the viscometer correlate with how the adhesive/sealant settles into position after application, while high rotational speeds simulate spraying, rolling, squeezing or scraping the material onto the substrate surface. Testing flow behavior over a range of rotational speeds is the smart approach in today’s QC lab because it mimics the way that customers will try to use the adhesive or sealant in actual practice.
Other test parameters of interest are the yield stress of the material and its creep behavior. Measuring the yield stress of the material can answer questions including: How much force does it take to initiate movement and start the material flowing? Does the applicator exert sufficient force on the adhesive/sealant to cause flow to begin? Once flow begins, does it sustain until the material is in place in its intended position? Will it then hold position and not ooze away from its targeted destination (i.e., creep)? Modern low-cost controlled-stress rheometers can perform all of these tests directly on the material in one or two minutes of total test time.
Instrument Operation
Cone/plate geometry is the preferred choice for busy labs where lots of samples are tested daily (see Figure 1, p. 38). Small sample volumes, typically 1.0 mL or less, are needed for testing; therefore, temperature equilibrium is achieved within a very short time interval prior to start of testing. The spindle attaches to the instrument head and is brought down into contact with a flat plate on the base of the instrument where the sample has been placed. Excess material that squirts beyond the circumference of the spindle is removed prior to the start of test. The ease of sample handling/conditioning and rapid clean-up of residue afterwards explains why lab technicians opt for cone/plate instruments.
The plate spindle has a flat bottom, whereas the cone spindle is angled slightly relative to horizontal. The plate spindle is used with adhesives or sealants that are either highly viscous or have small particles embedded in the material; spatial separation (also referred to as “gap”) between the plate spindle and the base plate on which the sample is placed is determined by the nature of the test material (e.g., particle size diameter). Gap sizes may range from 50 microns (0.050 mm) to 500 microns or more. Cone spindles can have a range of angles from 0.8 to 3 degrees; common choices are 1-2 degrees. The tip of the cone spindle is machined away so that the spindle does not make contact with the plate during rotation. The gap for the spindle relative to the plate is determined by the “truncation value” which is the vertical distance along the axis of the cone spindle that represents the amount of material removed from the tip.
Spindle size for cones and plates is defined by the diameter of the measuring surface. Popular choices are 25, 50 and 75 mm. The smallest diameter is appropriate for measuring the highest viscosity range, while the largest diameter is used to measure the lowest viscosity range. This may not seem obvious; however, if you think of viscosity as resistance to flow, the spindle with the greatest surface area will have the highest sensitivity when measuring the lowest viscosity fluid.
Test Details
Test methods for determining flow curve, yield stress and creep can be accomplished in one integrated program after the initial investigative work has been accomplished. Following is a review of the individual tests and descriptions regarding the steps involved. A company’s R&D department will normally perform these tests during formulation development in order to define the test methodology needed in QC.
Yield Stress
Use a controlled stress ramp to find the yield point of the material. It is important to note that the rate of stress increase for the ramp will have an impact on the actual yield stress value that is measured. Employ a single ramp that seems to work for all the formulations in the test group.
Viscosity Flow Curve
Run a shear rate ramp to determine the viscosity flow curve; typical ramps might go from 0 to 100 inverse seconds or higher. (The “reciprocal” or “inverse” second is the unit of measurement for shear rate.) The result is a graph that shows change in viscosity as shear rate increases; most sealant and adhesive materials are pseudoplastic, which means that viscosity decreases as shear rate increases. The same shear rate ramp should be used for all tests.
Creep
Finally, run a creep test using the controlled shear stress method with stress set at a value relatively close to the yield stress. This will assess how slowly the material continues to flow once movement begins. One objective of this test is to assess whether gravity alone will cause the material to continue spreading out; for adhesives and sealants, this is generally not desirable behavior.
Test Case
The following product was tested for the discussed properties: Henry Crystal Clear all-purpose sealant in a 10.1 fl oz tube. The tube was mounted in an extrusion gun, and a small sample was placed on the base plate of the instrument (see Figure 1). All tests were performed at the control temperature of 25°C. The 50-1 cone spindle (50 mm diameter, 1 degree cone angle) was brought down onto the sample. Excess material around the circumference of the cone spindle was trimmed away. Separate tests were performed on fresh samples to measure yield stress, viscosity flow curve and creep.
The stress ramp used to measure yield stress went from 0 to 500 Pascals over a time interval of 2 min. Minor movement of the cone spindle started almost immediately, as shown in Figure 2a. The x-axis shows shear stress, while the y-axis indicates shear rate. A noticeable increase in spindle rotation occurred around 250 Pascals, indicating that this might be an approximate yield stress value.
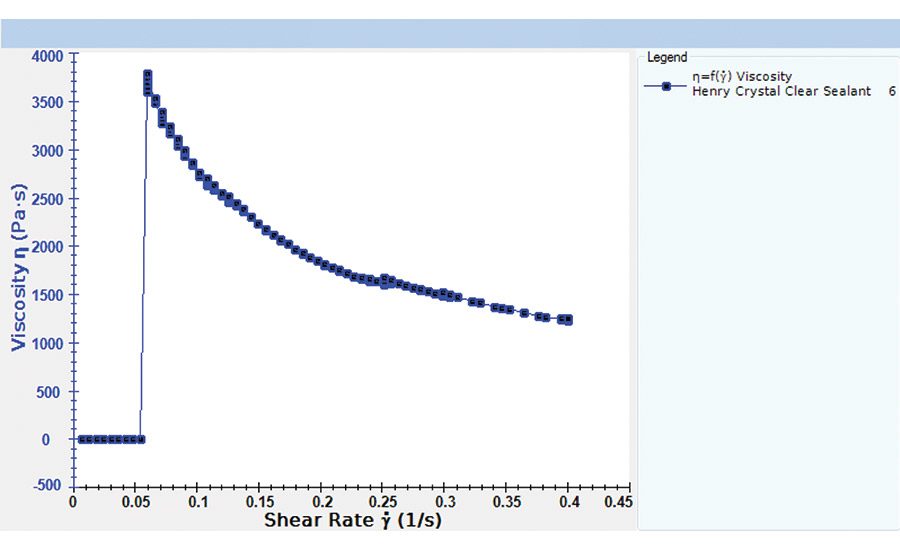
The same data obtained in Figure 2a was plotted again to show the viscosity flow curve. This is a plot of viscosity on the y-axis vs. shear rate on the x-axis (see Figure 2b). Note that viscosity decreases dramatically from more than 3,500 Pascal-seconds (3,500,000 cP) to less than 1,500 Pascal-seconds (1,500,000 cP) as shear rate approaches 0.5 inverse seconds. This is a reasonable picture of the slow extrusion process that takes place as sealant squirts out of the small opening at the end of the tube.
A second viscosity flow curve test could be run in the situation where the adhesive/sealant is spread further by the user after application to the substrate. The shear rate ramp used to measure the viscosity flow curve might run from 0 to 50 inverse seconds to simulate the force on the material imparted by the spreading action of the tool.
The creep test used a stress value of 300 Pascals, which is close to the material’s yield stress value of 250 Pascals, and applied it to the material for a 120-second time interval. Figure 2c shows a plot of deflection angle (rotation of the cone spindle measured in milli-radians) vs. time. Visual observation shows that movement of the sealant continues, but it is very small in actual distance and the trend appears to be approaching an asymptote. Therefore, the conclusion is that the material will hold its position relatively well once applied.
Thorough QC Processes
Yield stress and creep measurement, combined with viscosity flow curve analysis, provide a more thorough QC test to verify acceptable performance of adhesive and sealant materials. Improvements in viscometer/rheometer capability make these types of tests more practical in a QC lab.
The ability to integrate multiple tests into a single method and run the program automatically allows lab technicians to worry only about sample preparation and cleanup afterwards. QC limits built into data analysis firmware in the instrument provide pass/fail determination for each sample tested. Companies that want to improve daily product quality are making the investment in today’s new technology and reaping the benefit of increased customer satisfaction with consistently superior product performance.
For more information, phone (508) 946-6200, fax (508) 946-6262, or visit www.brookfieldengineering.com.


