


To create proper bonds for pressure-sensitive adhesives (PSAs), both the adhesive properties and substrate properties are critical. The highest concerns for the substrate are the surface chemistry and surface roughness. For PSAs, the intimate contact of the adhesive molecules with the molecules at the surface of the substrate can strongly affect overall performance.
For this article, the surface is considered the top 10 nm. Although bulk properties of the materials are critical to adhesion, chemistry and roughness at the bonding interface can compromise the adhesion of a system with good viscoelastic properties.
There are many ways to characterize substrates and their surfaces. For any analytical measurement, the methods used must be tailored to the scale that is relevant for the system. To understand surface chemistry, many analytical methods can be used to measure surface sensitivity. Here, we focus on methods sensitive to the chemistry in the top 10 nm or less, including surface energy measurements, secondary ion mass spectrometry (SIMS), and X-ray photoelectron spectroscopy (XPS). For surface roughness measurements, we focus on methods that help us quantify the contact area of an adhesive with a substrate, specifically optical profilometry. In addition, conventional microscopy methods like optical microscopy and scanning electron microscopy (SEM) are discussed in relation to surface texture.
The most common standardized pressure-sensitive tape performance tests are peel, shear and tack. Of these, it is useful to think of shear as most sensitive to bulk properties such as the degree of crosslinking and modulus of the adhesive. Peel and tack are strongly affected by surface interactions between the substrate and adhesive.
Many references speak to the differences between low surface energy (polyethylene, polypropylene, silicone, fluoropolymer) and high surface energy (metal, glass) substrates with regard to adhesion.1-6 Measurement of a substrate’s surface energy is one way to understand the surface chemistry; however, there are other considerations. Adhesives of similar chemistry to the substrate (acrylic adhesives to polymethylmethacrylate, or PMMA) may show better adhesion than the same adhesive to a substrate of similar surface energy. This is likely due to the chemical similarity between the two materials and the increased opportunity for van der Waals interactions. Another important facet of surface chemistry is that it may be different than the bulk chemistry. One example of this would be a substrate with foreign material, such as surfactant or silicone contamination. There are often many species naturally present at the surface of polymer substrates that are not contaminants, but byproducts of synthesis, process aids or additives used to prevent degradation of the material, such as antioxidants. These species may range from negligible effects on adhesion (antioxidants for example) to significant impact (fluorocarbon mold releases).
For surface energy determination, two common approaches are used: Dyne pens/solutions and calculating the surface energy from contact angle data. Both of these measurements rely on only a wetting interaction of the liquid with the substrate (as opposed to dissolution or reaction interactions). Although Dyne pens can be useful to monitor surface energies, they do not give detailed information in comparison to methods of calculating surface energies, such as the Owens-Wendt method.7 In addition, it is difficult to assess if there is solvent interaction with Dyne pens as they use a single liquid system. By comparison, using contact angles of multiple liquids and an Owens-Wendt fit, nonlinearity due to solvent interactions is easily assessed. Further, using the Owens-Wendt fit, the total surface energy is calculated as the sum of polar and dispersive energies. The % polarity (polar forces divided by total surface energy) can be a useful predictor of adhesion values.
Understanding surface chemistry on a molecular basis typically involves high vacuum surface analysis techniques, such as secondary ion mass spectrometry (SIMS) and X-ray photoelectron spectroscopy (XPS), also known as electron spectroscopy for chemical analysis (ESCA). SIMS data yield information about the molecular and elemental chemistry in the top 2 nm and XPS provides quantitative elemental and chemical state information in the top 10 nm, as it is typically operated. Used together, these techniques provide a comprehensive molecular picture of the chemistry at the surface.
Surface roughness can affect the contact area of the adhesive with the substrate. The scale of the roughness is important, as well as the ability of the adhesive to flow and fill in voids. The pressure used to create the bond on rough surfaces is also important to consider.8 If the adhesive can wet the entire surface, including all of the peaks and valleys, the contact area and bond strength will increase; if the adhesive cannot wet out the entire substrate, the contact area decreases and bond strength suffers.5,9-11 A simple example of this concept is to compare peel strengths from different widths of adhesive. We would expect the peel values (units of force/width, i.e., oz/in.) to double if the width of the adhesive doubles.
For this study, optical profilometry was used to measure surface roughness. This technique is a noncontact interference method that provides three-dimensional representations of surface features. Different roughness parameters can be calculated (e.g., Ra, Rq, etc.), which can provide useful metrics to compare different surfaces. SEM imaging and energy dispersive spectroscopy (EDS) are often used to support the profilometry images, although they do not easily provide roughness values.
This investigation focuses on the surface chemistry and roughness of substrates and the relationship to adhesion. We discuss the variability in surface chemistry and roughness of materials all nominally identified as the same material. For example, high-density polyethylene (HDPE) is a common material used for bottles, as well as a preferred low-energy substrate for PSTC adhesion testing. However, there are surface treatments used to increase adhesion, such as flame and the Fluoro-Seal Process®, which have much higher surface energies and different surface chemistry than the native HDPE.
To investigate the effect of roughness and chemistry on adhesion, a number of substrates will be compared. For example, corrugated cardboard surfaces can range in roughness, but are often similar in chemistry. In addition, they are an important substrate for packaging tapes and labels. HDPE and stainless-steel panels are used in many PSA labs to monitor and compare adhesive performance. Comparison of HDPE to steel is clearly a large chemistry difference; however, comparison of old and new panels can provide information about more subtle chemistry and roughness differences. Lastly, HDPE surfaces found on commercial bottles can vary in both surface chemistry and roughness.
Experimental
Adhesives and Peel Testing
Samples were prepared by direct coating the specified adhesive on 2 mil PET facestock and drying for 5 minutes at 80°C in a forced air oven. The target coating thickness for the adhesives was approximately 1 mil (~ 25 µm). The samples were covered with release liner and allowed to condition in a controlled humidity and temperature environment, according to PSTC standard conditions. 180° peels were evaluated via PSTC-101 test method.12 Two adhesives were chosen—one an untackified base polymer and the other the same base polymer with tackifier added. The base polymer in this case was an aqueous acrylic.
XPS
XPS data were acquired from samples as received, unless noted otherwise in the text. Four 400-micron oval areas were analyzed, and the data are reported as the average and standard deviation of those areas. Data were collected using a Thermo K-alpha instrument using monochromatic Al KαX-rays. Survey spectra were acquired with a 200 eV pass energy; high-resolution spectra were acquired with a 20 eV pass energy. The take off angle was 90°. Both charge neutralization and autoheight were used for data acquisition. Data were analyzed using Casa 2.3.17 Dev 6 3y software.
SIMS
SIMS data were acquired from samples as received, unless noted otherwise in the text. Data were acquired from three to four analysis areas using an IonTOF IV SIMS instrument. Representative data are shown in this article. The primary ion source was either Bi+ or Bi3+ operated at 25 keV in bunched mode. The pulse rate was 120 µs. Data were acquired for 100 frames from 500 x 500 µm areas of 128 x 128 pixels using a sawtooth raster pattern. Charge compensation was used for all samples. Data were analyzed using Surface Lab 6.5.69783.
Surface Energy
Surface energies were calculated using the Owens-Wendt method7 from contact angles of water, formamide and diiodomethane on each surface. At least four contact angles were measured for each surface using each liquid. Contact angles were measured using a Krüss G10 goniometer and tangent fit. All angles were used in the calculations. For surfaces with polar forces greater than 2 mN/m, the r2 of the fit to the data was greater than 0.9. For surfaces with low polar forces, the data fit well to a line; however, slopes, and therefore the r2, were low.
SEM/EDS
Uncoated samples were analyzed using a Hitachi S-3400VP-SEM at an accelerating voltage of 15.0 KeV, a probe current setting of ~ 65 and a chamber pressure of 25 Pa. EDS spectra were collected under the same operating conditions with the ThermoNoram SD detector for 30 sec. There are two contrast mechanisms in the SEM: edge contrast, where sharp edges appear bright; and atomic number contrast, where species of higher atomic number appear brighter than those of lower atomic number.
Optical Profilometry
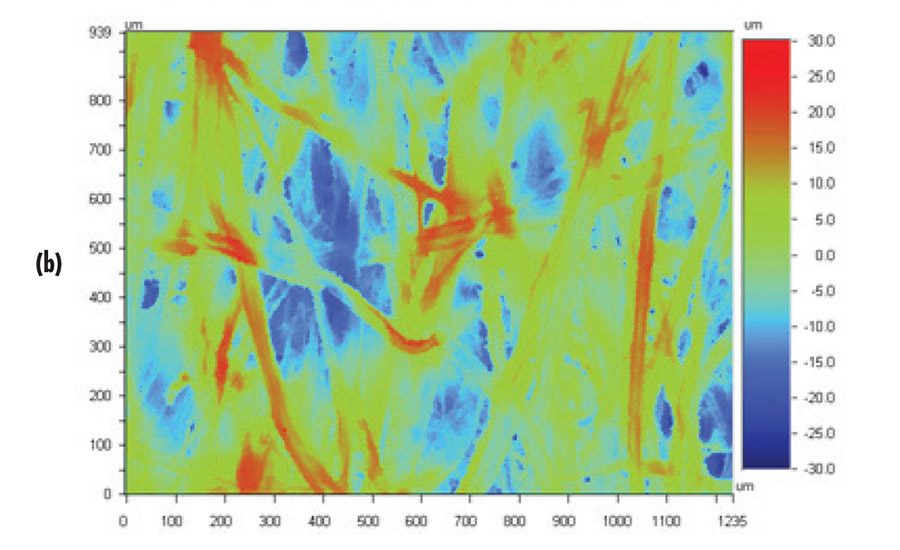
Samples were Cr coated with an Electron Microscopy Sciences EMS575X coater at 150 mA for two 1-minute cycles to increase their reflectivity. Several images of each sample were collected with a Wyko NT-1000 white light interferometer in VSI mode at a 1.2 mm horizontal field of view. In these images, color correlates to height, with red for the peaks, green for the middle, and blue for the valleys. The images were only corrected for tilt, and the “data restore” function was used to interpolate any missing data points.
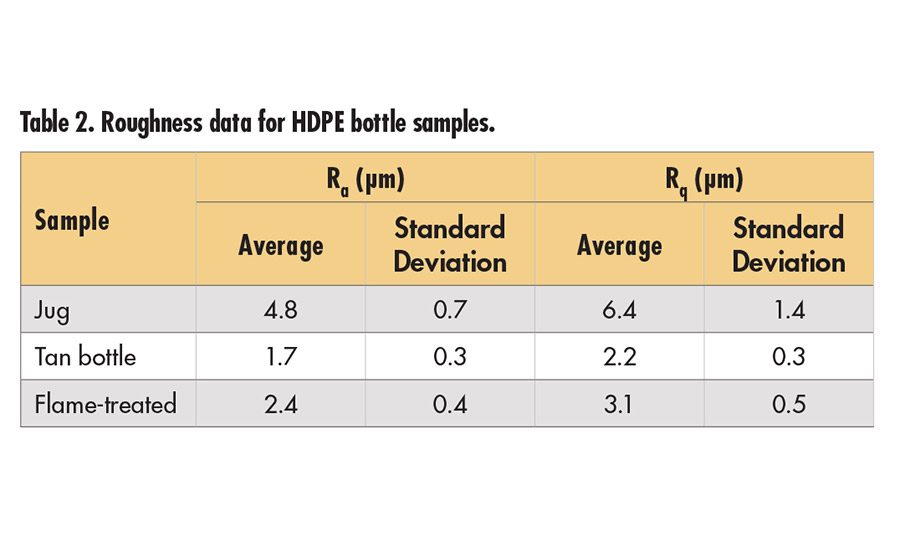
Ra is the roughness average, which is the main height as calculated over the entire measured area.13 Rq is the root mean square (rms) roughness, which is the average between the height deviations and the mean surface, taken over the entire evaluation area.13 The roughness values reported are the averages from all images.
Results and Discussion
HDPE Surfaces
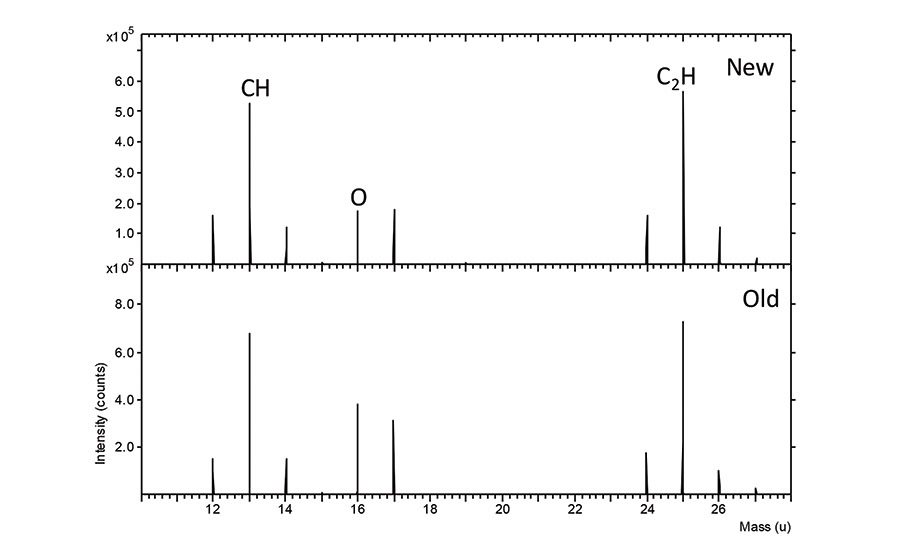
Peel data from the surfaces of HDPE panels and HDPE bottles can be found in Table 1. HDPE test panels, which were both new and previously used, were cleaned with isopropanol and tested. There is an increase in peel strength on the used panels with untackified adhesive, but no apparent difference with tackifier. Comparison of the surface chemistry of the panels when examined with ToF-SIMS is shown in Figure 1 (p. 16). The relative ratio of C to O is higher on the new panel. An increase in oxygen content on the old panel is consistent with the improved adhesion and could be due to surface oxidation of the HDPE.
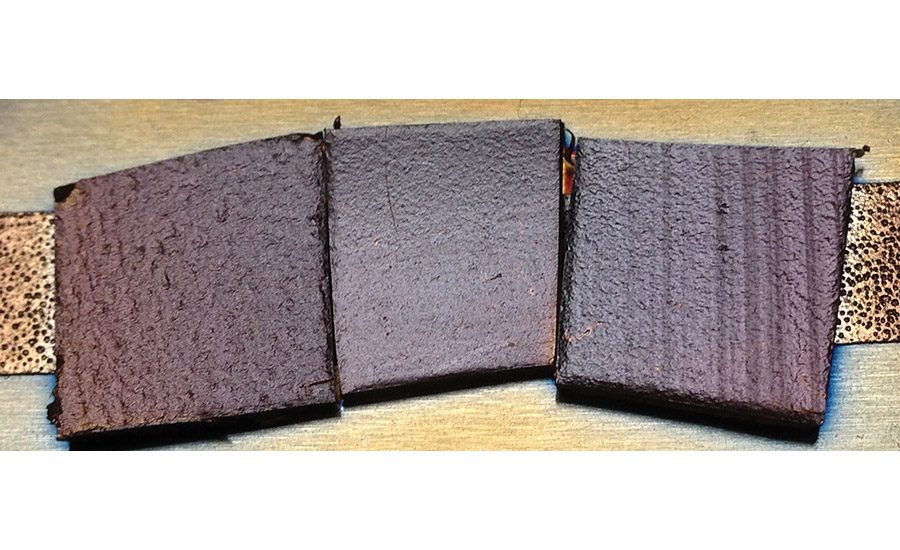
The bottles included in this study were sample bottles (empty) of various shapes. Pieces were cut from the bottles and taped to a panel for adhesion testing. Although most were relatively flat, some—in particular the Fluoro-Seal treated bottles (level 3 and adhesion)—still had curvature that may influence the adhesion testing. The jug and tan bottle were not reported to have any surface treatments, and have peel values in the range of the old HDPE panel for untackified adhesive. The bottles had differences in surface texture, as shown in Figure 2 (p. 16). Visual inspection indicates that the jug has the largest scale overall texture and the tan bottle has the finest, with the flame treated surface in between. The flame-treated surface has some lines present. Optical profilometry confirms the visual observations about surface roughness, as shown in Table 2 (p. 18). There is no obvious relationship between the peel data and the surface roughness.
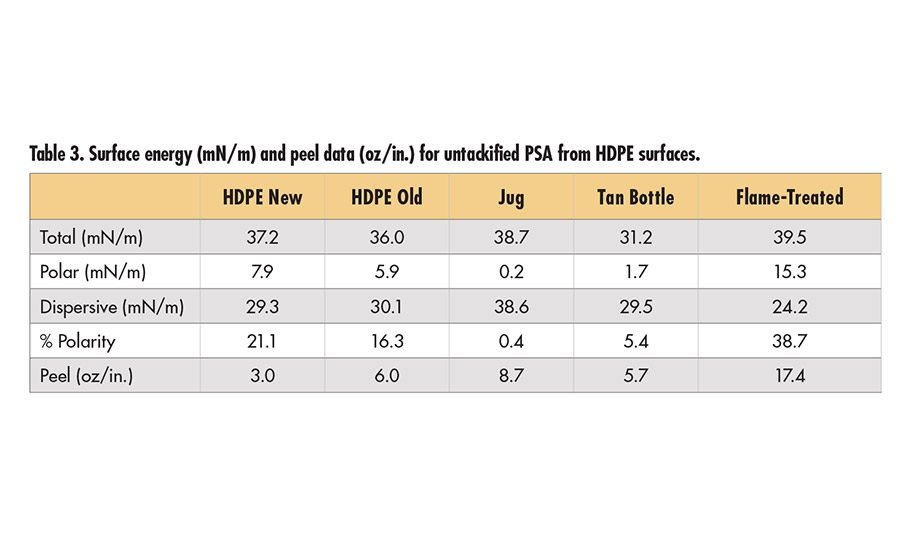
Surface energy data for the HDPE surfaces are shown in Table 3 (p. 19). The flame-treated surface has the highest polar forces and highest adhesion. It is common that polar forces or % polarity (polar forces/total surface energy) are proportional to the adhesion data. Here, this does not appear to be the case. The HDPE panels have significant polarity, yet no appreciable increase in adhesion over the jug and tan bottle. In fact, the surface energy data are inconsistent with the ratio of oxygen to carbon shown in the SIMS data above. Based on the SIMS data, higher polarity would have been expected on the old HDPE surface.
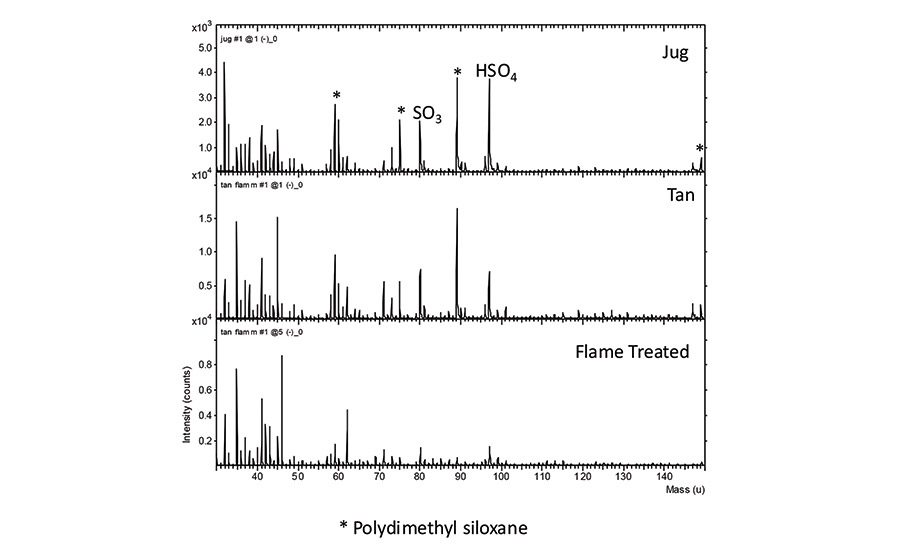
These inconsistencies between different types of analytical data illustrate the need to fully analyze a surface with consideration of the performance data in order to determine which factors are driving the performance. XPS results are shown in Table 4 (p. 19) for the bottle surfaces. HDPE surfaces typically show only C and O and sometimes low levels of P from antioxidants (in this case, the same bottle without flame treatment had an oxygen level of 0.2%). In this study, both the jug and tan bottle have N, Na, S and Si at the surface. The XPS data do not indicate the specific molecular species contributing to these elements. Examination of the SIMS spectra in Figure 3 from these surfaces shows that both the jug and tan bottle have polydimethyl siloxane (silicone) on the surface. The measured peel values on the jug are slightly higher than on the tan bottle, which could be linked to the difference in the amount of silicone at the surface. Both samples also show evidence for lauryl sulfate in the SIMS spectra (molecular ion is detected, but not shown) as signal at SO3 and HSO4. In contrast, the flame-treated surface has significant O (nearly 10%) as well as fewer contaminants, which is consistent with the high peel values for this surface.
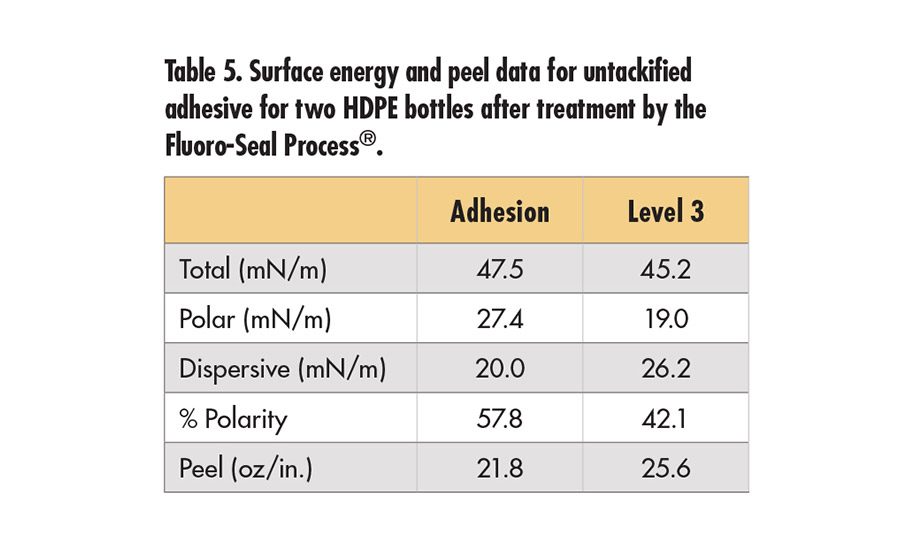
The Fluoro-Seal Process™* is a surface treatment that can be applied to HDPE.14 Two Fluoro-Sealed bottles (natural HDPE) were provided for this study. One is treated for chemical resistance (level 3) and the other for increased adhesion. The data shown in Table 5 (p. 19) reveal very high surface polarities, surface energy and peel values, compared to the earlier data for untreated HDPE in Table 3. The results are comparable to the steel panel data shown in the next section both in terms of high peel and surface energy. The bottles had some curvature, so comparison of the peel data on an absolute basis may not be valid; however, the peel results are higher than any other HDPE surface studied here. XPS results, shown in Table 6 (p. 19), reveal high levels of F and O on the surface.
Steel Panels
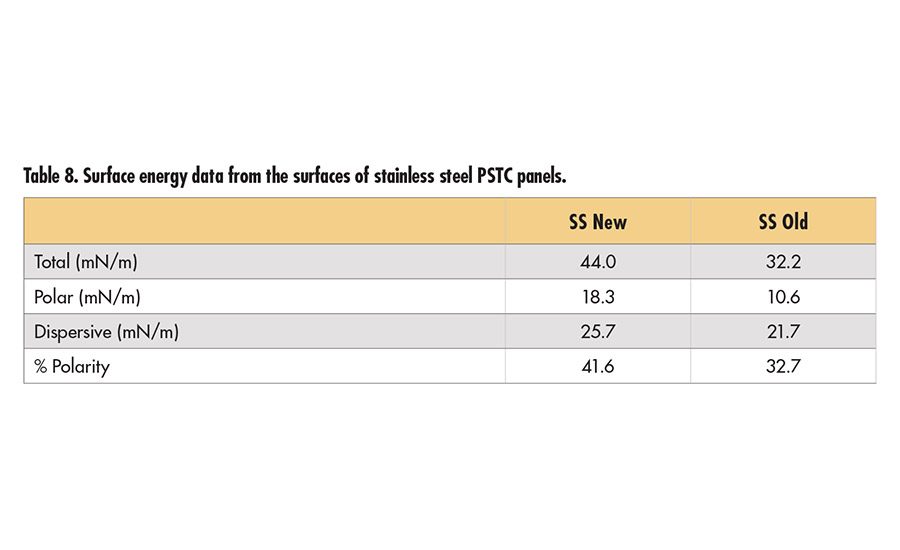
Old and new stainless steel PSTC panels were also compared in this study. High energy surfaces like steel and glass are easily contaminated through use or even storage in air.15 Only untackified PSA data are considered (see Table 7, p. 19), since the tackified adhesives separated from the backing during peel testing, indicating the weaker interface is the adhesive to PET backing and not the adhesive to steel interface. Prior to heating in an oven and cleaning with acetone, the old panel has notably lower adhesion than the new panel. This is consistent with a lower surface polarity on the used panel as shown in Table 8 (p. 19). These surface energies are lower than those found in literature15 for similar substrates cleaned by similar methods
(~ 55 mN/m). When trying to understand adhesive performance with substrates it is often not sufficient to use published values since the actual surfaces may be quite different. In fact, the surface energy of solid stainless steel can range from 34 to > 250 mN/m.16
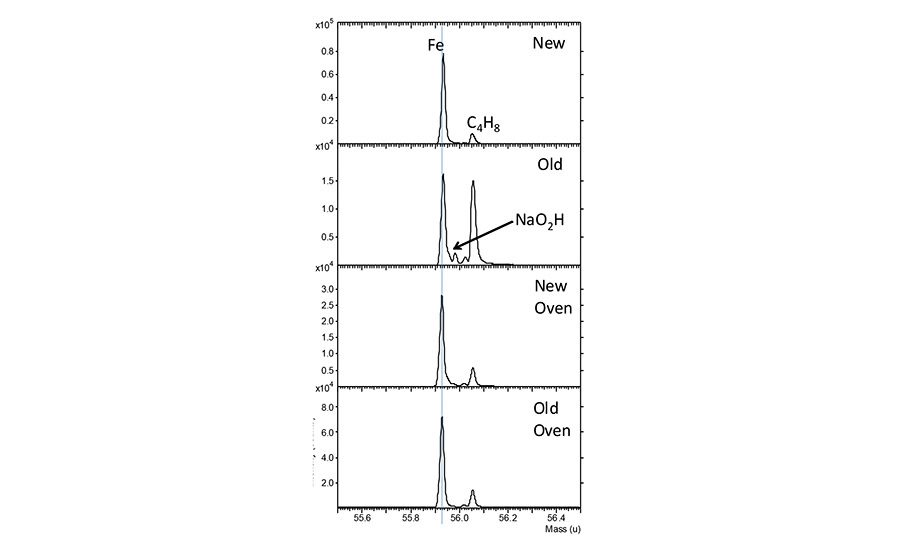
Examination of the SIMS data from the stainless steel surfaces shown in Figure 4 reveals that the Fe peak is less intense on the old panel. However, after oven heating, the Fe level increases on the old panel to levels comparable to the new panel. The ratio of hydrocarbons to the Fe on the surfaces may be the most important factor in adhesion. Any increase in the hydrocarbons on the surface will decrease the surface polarity and potentially contribute to lower adhesion. This is consistent with peel values increasing on the old panel after oven cleaning.
Corrugated Cardboard
Corrugated cardboard sold with varied recycled content was obtained to understand the influence of recycled material on PSA properties. XPS data and peel data for the untackified adhesive are shown in Table 9. The surface chemistry of the cardboard surfaces is similar, yet the peel values are much lower on the 100% recycled box. This implies the peel is strongly affected by something other than surface chemistry.
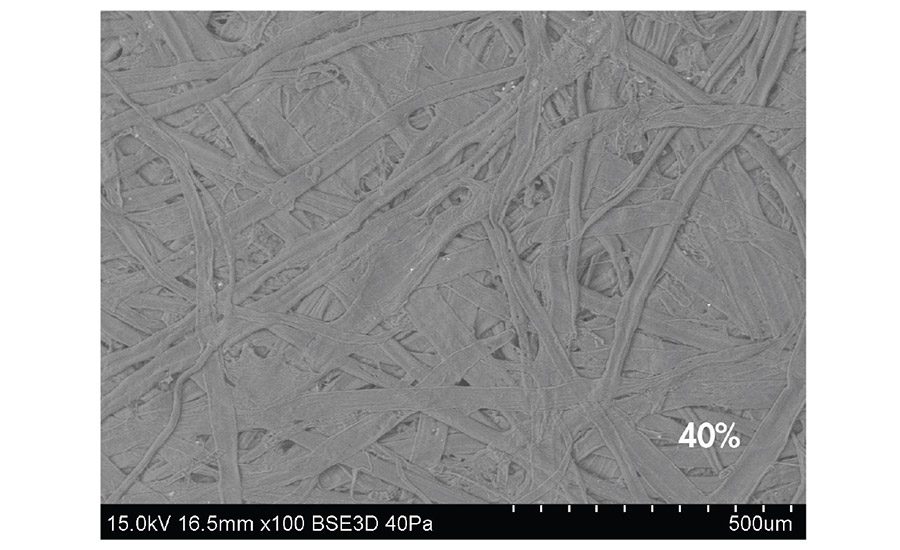
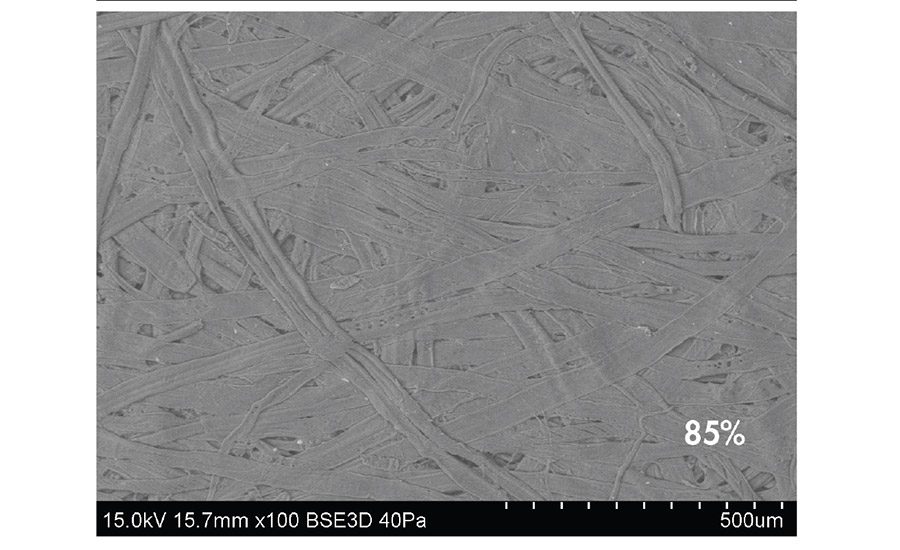
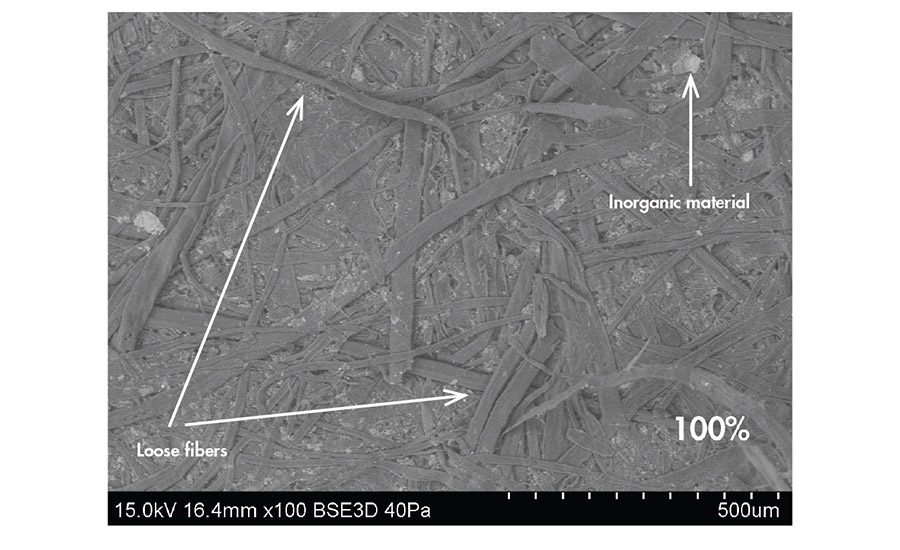
SEM images show that the 40% and 85% recycled samples have a similar appearance (see Figure 5, p. 17). Both have well-adhered fibers and a smooth appearance that is typical of calendared material. There does not appear to be much inorganic material present at the surfaces of these cardboards. The 100% recycled sample has a different appearance; it is not as smooth and has fibers that are loosely adhered or sticking up from the surface. This sample has some inorganic material present between the fibers, which appears bright due to atomic number contrast. By EDS, the 100% recycled surface has less C, but similar O, and significantly more Al and Ca than the other two samples (data not shown). The 100% recycled also has a Si peak that was not present in the 40% and 85% recycled samples. EDS has a significantly deeper information depth (1-2 µm) compared to XPS. Based on the data from both techniques, the inorganic particles seen in the SEM data may be covered by organic material and not detectable by XPS.
Optical profilometry of the corrugated cardboards confirms the observations made from the SEM images. Representative images are shown in Figure 6 (p. 18). The roughness data, shown in Table 10 (p. 20),confirm that the 40% and 85% recycled samples have similar surface roughness. The 100% recycled sample is significantly rougher. Higher surface roughness and loose fibers on the surface of the 100% recycled paper are the likely cause of lower peel.
Conclusion
A selection of surfaces relevant to PSAs was characterized by several analytical tools to understand what substrate properties can affect peel. In some cases, such as steel and HDPE panels, the surface chemistry of the substrate is the dominant influence to adhesive performance. In the case of corrugated cardboard, the surface roughness and fiber integrity were critical to adhesion. Comprehensive analysis of the surface chemistry and roughness of the substrate can lead to ideal PSA selection, as well as aid in troubleshooting for any system showing less-than-ideal adhesion.
The data presented in this study also illustrate the importance of considering both the adhesion data and the analytical data simultaneously to determine the factors most important for a given adhesive/substrate system. For example, the surface roughness of the bottles varies, but does not vary systematically with the peel data. But, the surface chemistry of the flame treated bottle (high O and surface polarity) indicates why peel is high. Similarly, both the surface chemistry of the substrate and surface roughness can be investigated to guide troubleshooting where the adhesion is not at the desired level. Lastly, there are specific substrate and adhesive combinations that end users define as key for qualifying adhesives. This study demonstrates that the selection of substrate surfaces has a major impact in determining if a given adhesive meets performance targets.
For more information, contact Michaeleen Pacholski, 400 Arcola Rd., Collegeville, PA 19426; phone (610) 244-6302; email MPacholski@dow.com; or visit
www.dowpackaging.com.
Acknowledgements
The authors would like to thank many people who made this study possible. Most of the bottles characterized here were provided courtesy of Berlin Packaging. The Fluoro-Seal treated HDPE bottles were provided by Steve Banko from Inhance Products. Select corrugated cardboard materials were provided by Green Bay Packaging. Peel data were collected by Frank Pugliese.
References
1. C. Creton, J. Hooker and S. KR, Langmuir, vol. 17, pp. 4948-4954, 2001.
2. M. Toyama, T. Ito and H. Moriguchi, Journal of Applied Polymer Science, vol. 14, pp. 2039-2048, 1970.
3. M. Toyama, T. N. H. Ito and I. Masamichi, Journal of Applied Polymer Science, vol. 17, pp. 3495-3502, 1973.
4. R. Jovanovic and M. Dube, Ind. Eng. Chem. Res., vol. 44, pp. 6668-6675, 2005.
5. Y. Peykova, O. Lebedeva, A. Diethert, P. Muller-Buschbaum and N. Willebbacher, International Journal of Adhesion & Adhesives, vol. 34, pp. 107-116, 2012.
6. A. Kowalski, Z. Czech and Byczynski, J. Coat. Technol. Res., vol. 10, no. 6, pp. 879-885, 2013.
7. D. Owens and R. Wendt, Journal of Applied Polymer Science, vol. 13, pp. 1741-7, 1969.
8. C. Creton and L. Leibler, Journal of Polymer Science: Part B Polymer Physics, vol. 34, pp. 545-554, 1996.
9. C. Hui, Y. Lin and B. JM, Journal of Applied Physics Part B: Polymer Physics, vol. 38, pp. 1485-1495, 2000.
10. C. Hui, L. YY, J. Baney and E. Kramer, Journal of Polymer Science Part B: Polymer Physics, vol. 39, pp. 1195-1214, 2001.
11. Y. Peykova, S. Guriyanova, O. Lebedeva, A. Diethert, P. Muller-Buschbaum and N. Wilenbacker, International Journal of Adhesion and Adhesives, vol. 30, pp. 245-254, 2010.
12 N. Thongyai, S. Daowphiset and N. Pungwait. [Online]. www2.mtec.or.th/th/seminar/Msativ/pdf/S04.pdf. [Accessed 12 February 2014].
13. "wikipedia," [Online]. http://en.wikipedia.org/wiki/Surface_roughness. [Accessed February 20, 2015].
14. "Inhance Products," [Online]. inhanceproducts.com.
15. N. Thongyai, S. Daowphiset and N. Pungwiwat. [Online]. www2.mtec.or.th/th/seminar/Msativ/pdf/S04.pdf. [Accessed February 12, 2014].
16. M. Mantel and J. Wightman, Surface and Interface Analysis, vol. 21, pp. 595-605, 1994.


