While this is an obvious answer, the identification of suitable product opportunities is far less apparent, especially in an industry as fragmented as the U.S. adhesives industry. This industry is not only fragmented by market segment and market niche, but also by formulative technology, raw material, and manner of selling to the market. This fragmentation is a double-edged sword - there is a large number of potential opportunities, but it is particularly difficult to identify all or most of these opportunities because of fragmentation.

Identifying the various product opportunities is a tall task for any company, even very large ones. For this reason, one or more well-regarded, multi-client industry studies can be helpful, in addition to intelligence supplied by internal sources and/or a well-informed consultant. Through such an undertaking it is necessary to understand the size and growth rate of the opportunity and the competitive atmosphere in which it exists.
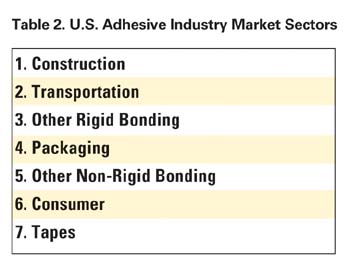
The construction sector contains all of the adhesives used in the construction industry, just as the transportation sector contains all adhesives used in various transportation applications (e.g., as autos, trains, planes and boats). However, a closer view of these two sectors recognizes that most of the bonding operations contained within them involve the bonding of one rigid substrate to another rigid substrate, yet there are many rigid-to-rigid bonding operations that are not contained within these two sectors. Obviously, there was a need to create another rigid-bonding sector.
The importance of each of these sectors to the U.S. adhesives industry in value and volume is shown in Figure 1.
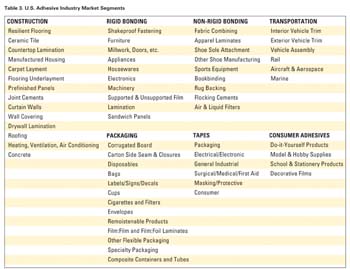
Once these seven sectors were established, ChemQuest subdivided them further into 61 different market segments (see Table 3). Each of these 61 market segments was studied separately in an effort to not only understand the size and growth rate of each segment, but also the size and growth rate of each competing formulative technology and each raw material family.

Once compiled, the database provides an understanding of the overall size and growth of the industry, or any market sector or any market segment, as well as any formulative technology or raw material category. Even more important to the pursuit of opportunity identification is the fact that the database provides an understanding of the size and growth of almost 2,300 product opportunities. In this regard, a "product opportunity" is defined as "a specific raw material, which is used in a specific formulative technology, which is then used in a specific market segment."

When this database is carefully examined, it can be seen that only 15% of the opportunities are growing at twice the industry rate, and only 4% are growing at three times the industry rate. This tends to highlight the difficulty in selecting growth opportunities from the large body of opportunities in the industry.
Once identified, it is important to recognize that all opportunities are not equally attractive to all companies; each company brings a different set of strengths and weaknesses to the analysis. For example, each company has different sales and marketing strengths in specific market segments, or different formulating strengths with specific raw-material families, or different manufacturing strengths in specific formulative technologies. It is careful consideration of company strengths vs. growth opportunities that helps to identify those worthy of investment consideration. The ChemQuest process used in this rigorous methodology will be the subject of a future article.
In a worst-case scenario, a company may find that there are few-to-no attractive opportunities that overlap the strengths of the company. In that case, the database is equally well suited to help the company identify technologies it should consider licensing or companies it should consider acquiring so it can participate in higher growth opportunities.