An online exclusive from Dr. Deny Kyriacos, President of GEM-Chem, Brussels, Belgium

Figure 1: Chemical formula of an aromatic polyisocyanate
A poly(methylene phenyl) isocyanate can be represented , by the chemical structure shown in figure1.

where n is the average number of repeat units. In the simplest terms, if n=0, the resulting structure is that of phenyl isocyanate and, if n=1, the structure of pure MDI is obtained. The formula in figure 1 leads eventually to a general expression for the number average molecular weight.

Furthermore, the corresponding isocyanate equivalent (IE) can be expressed by the following formula:

Similarly, the NCO content can also be easily calculated by the formula:

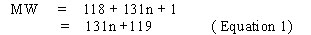
For phenyl isocyanate, where n=0, it follows that MW = 119, IE= 119, %NCO = 35.29 In the case of MDI, where n=1, the calculations lead to the following values MW = 250, IE = 125, %NCO = 33.60

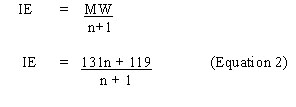
IE and %NCO of polymerics

Whenever the polyisocyanates are the result of a polymerisation process, n assumes an average value. The equivalent weight of species with an n value approaching infinity can be calculated as follows.

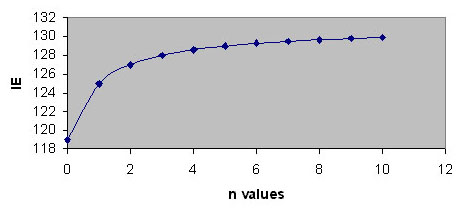
Figure 2: Variation of isocyanate equivalent with the number of repeat units
The results are represented graphically in figure 2. The curve is obtained by substituting n values in equation 2.

Therefore, any polyisocyanate with the structure given in figure 1, cannot have anisocyanate equivalent value higher than 131. Any experimental number, higher than 131 will suggest the absence of free NCO groups (dimerisation, carbodiimide formation, prepolymerisation, uretonimine formation, etc.) or the presence of unreactive chemicals contributing to an equivalent weight increase. In a similar way it can be shown that %NCO reaches a limiting value, when n tends to infinity.

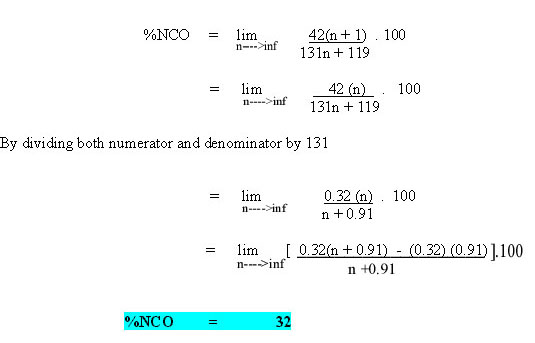
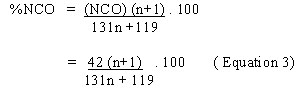
Figure 3: Variation of NCO content with the number of repeat units
Therefore the NCO content of any isocyanate having the structure shown in figure 1, cannot be lower than 32%.The results are expressed graphically in figure 3. Here again the curve has been drawn by introducing values for n, in equation 3.

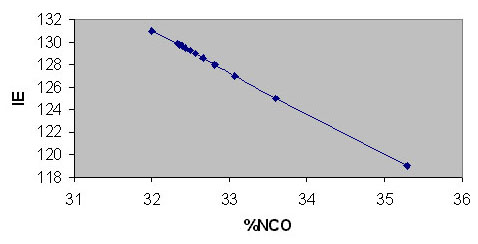
Figure 4: %NCO for different IE values
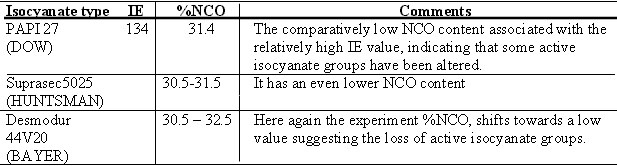
Finally, the relationship between the %NCO and isocyanate equivalent is obtained from the corresponding values in figures 2 & 3. This is expressed graphically in figure 4.

Table

Application of the results to commercially available isocyanates

By comparing the calculated values, to the corresponding ones appearing on data sheets of commercial products, a clearer insight on the chemical structure of those products can be attained. This is shown in the Table.