Formulating by Design
During the past several years, polyurethane reactive (PUR) hot-melt adhesives, also known as reactive hot-melt adhesives, have grown in use in the product assembly market. As a result, extremely diverse applications and requirements for PUR hot-melt adhesives are being encountered.
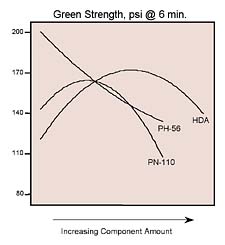
Our customers are frequently PUR hot-melt adhesive companies who think of us as a "chemical company's chemical company." To simplify formulation tasks when searching for hot-melt solutions, we developed a design of experiments (DOE) ‘mapping' approach to our new ortho-phlathic-based polyol products. Our objective was to help formulators discover how our products work within their specific applications. Armed with this DOE mixture design map, adhesives chemists can now review the typical properties these esters provide, including open time (how long an adhesive can still bond with another surface after being applied), green strength (how quickly a bond strength develops), and substrate bonding profiles.
Mixture Design Advantages
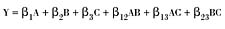
Mixture design DOEs are an efficient method for studying products made from the same components at various levels. This is because a relatively low number of blends are required. Of course, mixture designs may be created using any number of components, but as the number increases, so does the number of blends. For example, a quadratic three-component model revealing component synergisms and nonlinear effects requires at least six blends. The adjacent equation demonstrates what this model looks like for a predicted response (Y) in the adjacent equation.This equation has six coefficients (the ßs), so a minimum of six unique blends is required. The letter variables A, B and C represent the three mixture components we're about to look at in more detail. Mixture models can be recognized by their lack of an intercept. The one above is second order, with second order terms like AC and BC revealing interactions.

Aided by DOE software, we recently conducted experiments to reveal the complex effects of three components on a proprietary adhesive. Hexanediol adipates (HDA), which exhibit a melting point of about 54-60°C, are common in PUR hot-melt adhesives. They can be converted into prepolymers of 1.5 to 2.5 wt. % isocyanate by reaction with isocyanates (usually 4,4'-diphenylmethane diisocyanate, MDI). These prepolymers generally retain a thermoplastic nature, thus providing the basis for many reactive hot-melt adhesives. Other polyols are often used to modify the properties of these hot melts. By starting with an HDA as a base component, and adding two other polyester polyols to enhance or modify the properties, we created a three-component mixture experiment. MDI is a fourth component, but always present in approximately the same amounts if all the polyol molecular weights are nearly identical.
To characterize the behavior of our ortho-phthalate-based polyols in this PUR hot-melt adhesive, we created a three-component mixture design with the aid of Design-Expert® software (Stat-Ease Inc.). We evaluated the following HDA and two phthalate polyols (STEPANPOL® brand)
A. 4,000 molecular weight 1,6-HDA diol
B. STEPANPOL PN-110
C. STEPANPOL PH-56.
Only component A (the HDA) is a solid at room temperature, so too little of it in proportion to the other materials would cause the mixture to liquify. Therefore, we set a lower constraint of 50% on the HDA. Because mixture components must always total 100%, the component proportions are represented as:
- 50% = A = 100%
- 0% = B + C = 50%.
(When the percentage of one component is changed, the percentage of one or more of the other components must be changed so that A + B + C = 100%. The response is a function of the proportions of the ingredients, and is not dependent on the amount of the mixture.)
Three-component mixtures were reacted with MDI to determine their relative effects on viscosity, open time and green strength values. Eleven products were prepared as specified by a simplex centroid design. A simplex is a geometric figure with one more vertex than the number of dimensions. The simplex region for two components is a straight line, for three components a triangle, for four components a tetrahedron, and so on. The three components we have here form an equilateral triangle. A simplex centroid includes a blend with all three components at the center of the triangle. The DOE software we used includes this template, making design setup very easy.
To estimate lack-of-fit, mixture designs require additional unique blends beyond those needed for model estimation. Lack-of-fit measures how well the model fits the data relative to pure error. If a model has a significant lack-of-fit, it's not a good predictor of the response and shouldn't be used. The lack-of-fit test requires two things: excess design points beyond the number of terms in the model, and replicate points. As shown in the table, we replicated four blends. Replication provides an estimate of pure error (normal variation that occurs when an experiment is repeated).
The raw data from the 11 blends (including the replicates) appear in the table. Because properties such as open time and green strength tend to be influenced by differing application techniques and substrates, the absolute data may be difficult to reproduce precisely by other experimenters. However, the information displayed here should be helpful for determining general trends.
Plotting To Perfection
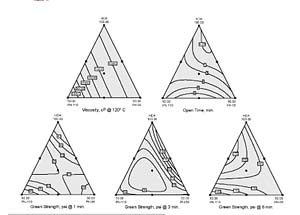
Figure 1 shows Design-Expert contour plots of predicted responses. They helped us identify formulations meeting performance criteria for a small-product assembly application needing the following.- 120°C viscosity less than 15,000 cP
- One-minute green strength of at least 25 psi
- An open time of three minutes or more


Momentous ‘Mapping'
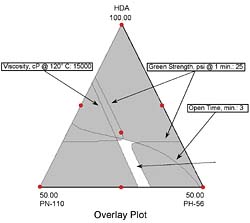
Statistical mixture design tools helped us study the conversion of three polyol blends (hexanediol adipate and two phthalates) into a reactive hot-melt adhesive with MDI. The resulting properties of product viscosity, open time, and green strength were modeled as a function of polyols used. These models formed the basis for contour plots, which revealed how adhesive characteristics change with composition. By overlaying several of the plots, we identified the sweet spot for small-product assembly needs.Design-Expert® is a registered trademark of Stat-Ease Inc.
STEPANPOL® is a registered trademark of the Stepan Co.
This article is based in part on a presentation given at the Adhesive and Sealant Council (ASC) Fall 2002 Convention.
For more information, contact Stepan Co., 22 W. Frontage Road, Northfield, IL 60093; phone 847-446-7500; fax 847-501-2466; e-mail khillshafer@stepan.com ; or visit http://www.stepan.com .
Links
Looking for a reprint of this article?
From high-res PDFs to custom plaques, order your copy today!


