Bond Evaluation Via Acoustic Microscopy
In practical applications, the microscopes are often used to determine whether two materials are successfully bonded, and whether there are delaminations, voids, or other anomalies at the bond layer. The data in the acoustic images often gives significant clues about process control issues.
An acoustic microscope has an ultrasonic transducer that both pulses ultrasound into the target and picks up the return echoes from the interior of the target. Because ultrasound doesn't travel well through air, the transducer is coupled to the sample by water or another fluid. The transducer normally scans one line across the target, moves ahead one space and scans back across the target. At each x-y coordinate, the transducer emits a pulse of ultrasound and receives return echoes from the various depths in the sample.
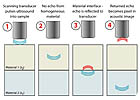
The ultrasound echo intensity from each x-y coordinate will become a pixel in the acoustic image. When the pulse of ultrasound is beamed into the target, it travels downward into the target until it exits the bottom side or until it is completely absorbed. Suppose that the target is a plastic material adhesively bonded to a metal. The ultrasound will first travel through the plastic. If the plastic is truly homogeneous, no echoes will be returned from the bulk of the plastic. Non-reflection is a key characteristic of ultrasound in homogeneous solids.
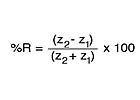
But when the pulse of ultrasound strikes the interface between the plastic and the metal, some degree of reflection will take place (see Figure 1, #3). If the plastic and the metal are well bonded, two events will occur: a portion of the ultrasound is reflected by the bonded interface back to the transducer, while a second portion crosses the interface and travels down into the next material layer. The degree of reflection can be calculated from two values: the density of each material, and the speed at which sound travels through each material. Speed multiplied by density equals acoustic impedance, which is represented by z in the formula:
Suppose that the target is a rectangular piece, consisting of a plastic layer bonded to metal. If all areas of the bond are uniform and free from anomalies, then the acoustic image will display a single shade of gray, or (if a pseudocolor display is being used) a single color. If the integrity of the bond is the concern of the microscope user, then a single color is what he hopes to see.
But if there is an anomaly such as a delamination or a void at the bond level, the acoustic image changes dramatically. Suppose that the rectangular sample described above is uniformly bonded except in one spot, where there is a circular feature that is basically a flattened air bubble. Even if this air bubble, or void, is as thin as 100Å, it has - acoustically - two interfaces, one with the plastic above and one with the metal below.
As soon as the pulse of ultrasound hits the plastic-air interface, practically all of the ultrasound is reflected back to the transducer. The extremely high reflection at any interface with air or another gas is caused by the extremely low density of the gas and its extremely low acoustic velocity. Generally speaking, audible sound travels through air and other gases without much loss; but VHF ultrasound doesn't.
The very high reflectivity at gap-type interfaces has two significant consequences. First, it means that delaminations, voids and cracks are displayed in high contrast in the acoustic image. Second, any significant features that lie beneath the gap-type defect will not be imaged because none of the pulsed ultrasound will reach them. (To see features below the defect, the simple solution is to turn the part over and image it from the other side.)

Most of the bonded area is a uniform shade of gray. Uniformity is generally a good sign because bonds of this type sometimes display a range of color indicating that there is some variation in the bond. The numerous red areas, however, are voids at the bond depth. In the pseudocolor used here, red represents the highest degree of reflection, and high reflection at this interface means a lack of bonding, even if the gap is extremely thin.
Since ultrasound travels through a material at a specific speed, return echoes from different depths within the sample arrive back at the transducer at slightly different times. For accuracy, the transducer is usually focused on a specific depth of interest. To make the acoustic image, return echoes are selected only from a time window that corresponds to the same depth. The echoes are said to be "gated" on a particular depth.

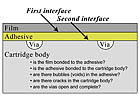
Figure 3 was made during the early stages of R&D, as might be surmised from the details of the image. Gating and focusing encompassed the depth from the bottom of the plastic film to the bottom of the etched channels. In the diagram in Figure 4, gating and focusing would reach from the first interface to the bottom of the channels.
As in Figure 2, red areas indicate gaps, where there is an interface between a solid material and air. Where the film lies above one of the channels, red is the desired color, because the channel should contain nothing but air. Toward the bottom of the image, one channel is markedly narrowed, and other channels are completely obstructed - that is, they appear light gray, meaning that the interface is between the polymer film and a solid instead of between the polymer film and air. It appears that some of the adhesive has partly or completely filled these channels.
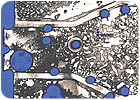
It is immediately evident that the bond is very imperfect. The variously shaped white areas (white meaning high reflectivity in this image) are voids and disbonds in the adhesive material. Well-bonded areas of the adhesive range more or less from light to dark gray, but there are so many white areas where there is no bonding at all that a significant percentage of the whole area consists of voids or disbonds. Voids are generally air bubbles, but a disbond may be caused by surface contamination that prevents the two surfaces from bonding.
The ability of the metal plate to subtract heat from the printed circuit board has been significantly reduced, perhaps to the extent where the circuit board, or the components on the board, will overheat and fail electrically.
The samples shown in this article all have specific depths of interest and were gated rather narrowly on those depths. In other situations, the microscope operator may gate more broadly in order to image features at different depths - for example, if the adhesive layer were unusually thick.
Some materials are not good subjects for acoustic imaging. Wood and paper are generally not suitable because they are so porous, and each pore acts as an air-filled gap that reflects ultrasound. But some materials are imaged in order to determine their porosity. An advanced ceramic, for example, may have many very tiny pores, and one measure of the quality of the ceramic may be the even distribution of those pores. For this sample, an acoustic image can show the distribution. Many composite materials contain tiny particles. Acoustic imaging can show the distribution of particles in a composite, and also whether the particles are bonded within the material or surrounded by voids that would greatly reduce strength.
Most acoustic imaging, though, is used to seek out defects that are a threat to product reliability - disbonds, delaminations, cracks and voids. For most of these defects, the only feasible alternative method of detection is physically cutting the sample open to examine its cross-section. The defects themselves may range from fairly large to extremely small. Some of the smallest defects occur in the adhesive layers inside microelectronics components, where the diameter of a void that has the potential to cause electrical failure may be as small as 20 microns (0.0008 inch).
Acoustic microscopes are often thought of as failure-analysis tools, although their useful roles have multiplied over the years. Certainly they are useful in imaging and analyzing defects that occur during production or in service. The failure analyst typically uses a laboratory-style acoustic microscope to image and analyze products or parts that have failed. He also typically uses a range of transducers and other tools to make the most data-rich image of the sample in question. After imaging comes the analysis - looking at the clues in the acoustic image ("Some of the adhesive has filled some of the channels") and asking questions such as, "What would cause the adhesive to migrate? Temperature? Pressure? Something else?"
The fact that acoustic imaging is nondestructive gives the analyst a second shot at the sample he is examining. After acoustic imaging has provided its data, the analyst can subject the still-intact sample to other tests, including physical sectioning. But he might also first want to try acoustic cross-sectioning, which can be performed many times on the same sample (more about acoustic cross-sectioning below).
Aside from routine failure analysis, acoustic imaging is also used in R&D, where it can quickly confirm that the internal structure of a part or assembly is bonded as it should be - or that further work is needed. In R&D and in prototype production, acoustic images can accelerate development because the feedback is so swift.
Recently, engineers have begun to use acoustic microscopes in an additional role: monitoring incoming parts or assemblies. This type of microscope usage has mushroomed with the growth of global outsourcing, and is probably most widely practiced in the electronics industry. Where truly large volumes of incoming parts are involved, completely automated acoustic systems are used. The systems usually run 24/7, automatically stacking and unstacking trays of parts. Depending on part size, one tray may contain as many as several hundred parts. Analysis of the acoustic images to identify parts that meet the user's defect criteria is also automated.
The basic purpose of outsource monitoring is to ensure that incoming parts are free from internal defects. If more than a given percentage of defects are found, the supplier may be held responsible. Overall, acoustic imaging of outsourced parts and subassemblies is employed in order to ensure that the economic savings achieved by outsourcing are not compromised by defects that degrade product performance or reliability.
The acoustic images that illustrate this article are all planar images - two-dimensional images of specific depths within a sample. Over the years, about a dozen additional imaging modes have been developed. Acoustic cross-sectioning, mentioned earlier, collects acoustic data from a single vertical plane and creates a cross-sectional view that is the equivalent of a physical section, without destroying the sample. Three-dimensional acoustic imaging uses several scans at increasing depths to collect the acoustic data for a 3-D view of internal features. Other modes include rotational imaging of cylindrical parts and thru-scan imaging to quickly find anomalies at any depth within a part.
For more information, contact Sonoscan Inc., 2149 E. Pratt Blvd., Elk Grove Village, IL 60007; phone (847) 437-6400; fax (847) 437-1550; e-mail info@sonoscan.com; or visit www.sonoscan.com.
Looking for a reprint of this article?
From high-res PDFs to custom plaques, order your copy today!


