The Rheological Evaluation of Sealant Materials

This article describes how rheological experiments can be used to simulate the application of sealant coatings and to determine their in-use performance. This has considerable value in assessing the applicability and effect of particular fillers, and in optimizing formulation of the product. A number of experiments were performed on sealant samples containing stearic acid modified magnesium carbonate as a filler, and the ability of rheological testing to discern differences between samples of similar composition was shown.
Sealant Characteristics
To function effectively, a sealant must display a number of key characteristics: it must adhere strongly to the components that are to be joined, it must be easy to apply, and it must not slump under gravity after application. In addition, a sealant has to resist fluctuations in temperature and be both cost-effective and environmentally friendly. To achieve the desired qualities, a sealant formulation contains a number of components, including polymer, plasticizer, pigment, filler, adhesion promoter, curing/crosslinking system and other additives, such as dessicants and stabilizers.
In many systems, the filler makes up a significant proportion of the weight of the formulation - as much as 40%. As a result, it exerts considerable influence on the rheological properties of the system. Materials used as fillers range from expensive, highly effective fumed silica to cheaper but less-effective natural products such as carbonates and silica. There has been a recent trend toward the use of coated precipitated carbonates; these not only offer effective performance, but are also intermediate in price. The usual coating material is stearic acid, which anchors to the precipitated carbonate as the calcium or magnesium salt during processing.
Rheological Analysis
Experimental work was performed using a Malvern Bohlin CVO rheometer to examine sealant samples containing stearic-acid-modified magnesium carbonate as a filler, with different levels of coating on its surface. The CVO rheometer is designed for easy configuration and therefore meets a variety of test requirements. Interchangeable temperature control units allow it to test all sample types from low-viscosity solutions to polymer melts.
Rheological characterization was carried out as follows.

Pre-Shear Creep
Examining pre-shear creep helps determine the behavior of the sealant following application. This is important since it must be easy to apply from a sealant gun but must not move prior to curing to ensure an effective seal. The pre-shear part of the test mimics the application from the gun, and the creep part of the test mimics the slump behavior.The test described below for determining pre-shear creep was designed to improve upon the slump test - the standard, simple test that involves placing a quantity of sealant onto a vertical surface with a graduated scale and measuring its movement over a given period of time. Since pre-shear followed by creep simulates high- and low-shear-rate (or stress) regimes, rheological characterization by pre-shear creep provides more application information than the slump test.
Determining pre-shear creep involves subjecting samples to a high shear stress (2500Pa) for a time that is sufficient to break down the structure. In this case, 15 seconds was deemed appropriate. This simulates the application of the sealant using a sealant gun. Once shearing is stopped, a small, constant stress is immediately applied to the material, simulating the flow response of the material under its own weight before it sets or cures. Sealant samples were labeled A through F with each containing the filler with increasing levels of coating. Previous slump testing had shown that Sample F slumped more than the others but that there were no discernible differences between Samples A to E.
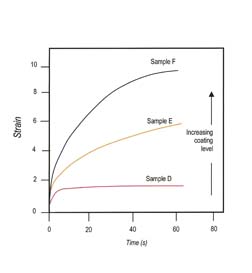
Figure 2 shows a similar plot, but includes Samples D to F, which again have progressively increasing levels of coating, all greater than that found in Sample C. It is interesting to note that when the level of coating is increased from the amount in Sample C to that of Sample D, the degree of apparent slump decreases. This suggests that the material has become less well dispersed and/or that the dispersing mechanism has changed. On further increasing the level of coating (from Sample E to F), the dispersability (and thus the flowability) appears to increase again.
The results of these experiments signify obvious differences between all six samples, whereas the traditional slump test had indicated only that Sample F slumped more than the others.
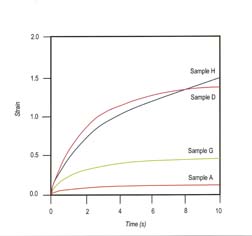
Note that in Figure 3 the timescale on the graph has been expanded to show the short timescale behavior of the samples, which more closely simulates the timescales of interest once the product has been applied.
In practice, these results demonstrate that new formulations can be assessed rheologically to determine their performance from application to use, aiding the development of formulations with the desired properties.
Stress Viscometry
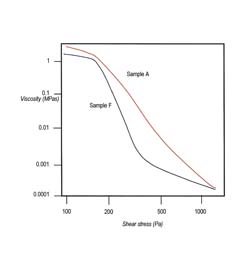
In further work, stress viscometry testing was applied to the two samples with the extremes of coating levels (A and F).Here, a constant stress is applied to the sample and the resulting shear rate is measured. Viscosity is calculated using the simple relationship:
Viscosity = shear stress/shear rate
The stress is then increased step-wise and the process repeated.
The curves shown in Figure 4 (viscosity vs. shear stress) indicate that there are discernible differences between the viscosities of the samples at low-shear stresses, but the curves become asymptotic at high shears.
These small differences between the samples tested, even at low stresses, indicate the value of using rheological experiments to simulate the deformation processes to which the materials are subjected, as is already shown in the pre-shear creep experiments. It should be noted that if only high-shear measurements were used to characterize the samples, then it is unlikely that differences between the materials would be seen. This shows that their application from the sealant gun (high-shear rate or stress) would be similar, but the responses of the materials after application (at low stresses prior to setting) would be different.
Conclusion
Simple tests, such as the traditional slump test, provide a measure of performance across only a very limited stress range, and cannot be used to fully characterize all the processes to which a sealant is subjected during application and use. Rheological characterization using low- to high-stresses (or shear rates) can be used to simulate the performance of a sealant across a full range of in-use situations. This starts with application using a sealant gun, through to determining whether or not the material will remain in the applied position in order to be effective. Rheological characterization can be used to assess the performance of new formulations with regard to the desired characteristics.For information on rheology instrumentation, contact info@malvernusa.com or salesinfo@malvern.co.uk; or visit http://www.malverninstruments.com.
Looking for a reprint of this article?
From high-res PDFs to custom plaques, order your copy today!


