Characterizing PSAs by Rheology


The cohesive strength of a PSA can be measured in continuous shear; a creep experiment is the most appropriate test. In practice, the damping behavior tan δ obtained in an oscillation test is used. Tan δ is the balance between loss modulus, associated to the energy dissipation or viscous deformations in a material and the storage modulus, and correlates well with cohesive strength. A PSA has a good cohesive strength for low tan δ values.
Performance and Frequency Dependence
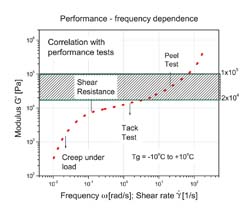
In an oscillation test, the frequency dependence of a PSA can be measured easily and quickly in a range from 0.01 to 100 Hz. The modulus in this frequency range at application temperature relates directly to the wetting and flow properties during application. If the modulus becomes too high, the ability to wet the substrate disappears.5 The viscosity must be low enough for the adhesive to spread and flow into the substrate in order to make good contact. Although low surface tension, low modulus or low viscosity are necessary for good wetting and flow, an adhesive is not a good adhesive unless its bonds are strong enough to resist separation.
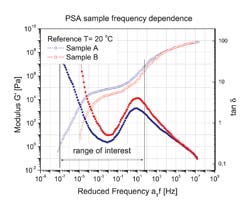
The experimental frequency range can be extended by making use of the t-T superposition (TTS) to create a master curve at the desired reference temperature. The procedure consists of measuring the material's properties in the same frequency range at different temperatures. The TTS is based on the fact that, at higher temperatures, molecular relaxation and rearrangements in viscoelastic materials occur at accelerated rates, and that a direct equivalence between temperature and time or frequency effects (thermo-rheological simple material) exists. If a material is thermo-rheologically simple in the frequency range of interest, the data of the isothermal frequency scans can be shifted until they overlap. The result is a master curve over a much wider frequency range at a free-selectable reference temperature.6
Glass Transition and Temperature Dependence
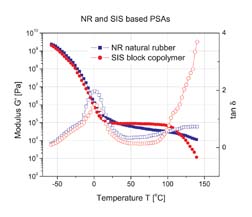
Instead of analyzing the frequency dependence of the dynamic mechanical properties of polymers, it is often more meaningful to look at temperature dependence. Many PSAs are block copolymers such as styrene-elastomer-styrene copolymers. The dynamic mechanical properties for a styrene-isoprene-styrene copolymer and a natural rubber-based PSA are plotted in Figure 3. The elastic modulus (G') exhibits a plateau region between the two domain glass transitions. The height of this plateau is governed mainly by the shape and size of the glassy domains of the polystyrene. Two glass-transition temperatures (Tg) are seen due to the two-phase structure of the block copolymers.
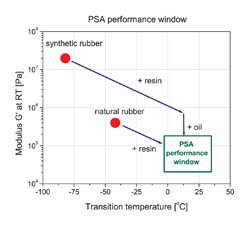
The PSA performance is dependent upon the glass-transition temperatures of the adhesive constituents relative to the expected use temperature. For room-temperature PSAs, a Tg of about -15°C to 5°C offers good adhesive performance. The temperature of the glass transition defines the lowest use temperature for an adhesive. The elastic modulus G' is approximately 1x10⁵ Pa for the SIS block copolymer adhesive and is independent of temperature in the range from 15 to 80

Tack Test
A pressure-sensitive adhesive adheres instantaneously to most solid surfaces upon the application of light pressure to the adhesive film. This behavior is a consequence of the adhesive being "tacky." A variety of performance tests have been developed to measure tack directly (ASTM D 2979-95, ASTM D 3121-94, PSTC-6, PSTC-5, etc.).An important method of measuring PSA tack is the probe-tack test defined by ASTM D 2979-95. This test employs a cylindrical steel probe with a flat surface of 5.0 mm in diameter. The probe is brought in contact with a PSA film at a fixed stress (usually 10 kPa) for a short time (typically 1s) and then removed at a constant rate. The maximum force required to pull the probe away is recorded; this maximum force is defined as the sample's tack.
A more complete analysis of tack would require the evaluation of force vs. distance to failure curve as a function of contact time, pressure, etc.9 The test consists of two steps: the application of the pressure (force and time are variable) followed by the withdrawal of the probe at constant pull-off speed. Figure 5 shows the force-distance curves obtained for three different PSAs.10 The pull-off speed used is 0.1 mm/s. Sample A shows adhesion failure, and the adhesive does not elongate when the probe separates. Samples B and C fail cohesively. The area under the curve, proportional to the energy to failure, has been evaluated. Sample C has the largest energy to failure and the longest separation time. Sample B is in the middle with an intermediate degree of tack and a yield force between those of sample A and C.
The failure energy - the area under the stress-strain curve - is a much more sensitive measure of tack compared to the height of the peak (maximum force) in the simple ASTM test11 and also correlates well with the loss modulus G" measured at around 1 Hz in an oscillation experiment.
Conclusion
Rheological measurements provide useful information for the processing, product development and application of adhesives. Practical parameters, such as flow, wetting, tack, cohesive strength and shear resistance, can be related to rheological properties. Comprehensive tack tests can be performed on any rheometer with linear test modes and the energy to failure can be calculated for a better evaluation of the tack performance of an adhesive.For more information on rheology, contact TA Instruments, 109 Lukens Drive, New Castle, DE 19720; phone (302) 427-4000; fax (302) 427-4001; e-mail info@tainst.com; or visit http://www.tainst.com.
References
1. Krieger, I.; Lee, L-H.; Lieng, Huang. "Flow Properties of Adhesives," Adhesive Bonding, Plenum Publishing, (1991) pp 31-45.2. Class, J.; Chu, S. J. Appl. Pol. Sci., 30, (1985) pp 805-842
3. Zosel, A. Colloid and Polymer. Sci., 263, (1985) pp 541
4. ASTM D 2979-95
5. Chu., S.G.; Lee, L-H. "Dynamic Mechanical Properties of Pressure Sensitive Adhesives," Adhesive Bonding, Plenum Publishing, (1991) pp 97-115
6. TAI application notes: RN011 "Application of t-T superposition in Rheology"; AAPN001 "Guidelines for using TTS"; AAN005e "Generating master curves"
7. Mazzeo, F. TAI application note RH082 "Characterization of Pressure Sensitive Adhesives by Rheology"
8. Bamborough, D. Adhesive Age, November 1990
9. Cole, P.J. "PSA Tack Using the ARES Rheometer," private communication (1999)
10. Rohn, C.L. "Analysis of Tack," TAI Internal document (1999)
Zosel, A. J. Adhesion, 32 (1991)
Figure 1. Storage modulus G' for a typical natural rubber-based PSA as a function of frequency with approximate strain rates encountered in typical operations associated with the manufacture and end use of a standard pressure-sensitive tape adhesive.
Figure 2. Master curve of PSA Samples A and B measured at temperatures from -90
Looking for a reprint of this article?
From high-res PDFs to custom plaques, order your copy today!


