Molecular Structure, Mechanical Behavior and Adhesion Performance of PSAs

The adhesion performance of pressure sensitive adhesives (PSAs) is determined by three properties: tack, peel strength and shear resistance. The shear resistance, which characterizes the behavior of an adhesive under static, long-lasting stresses, will not be discussed in this article. The work presented here is focused on tack; but tack and peel strength are similar in several aspects, so that some conclusions from our studies are also valid for peel strength.
Tack is a dominant property of pressure sensitive adhesives that is defined as the ability of an adhesive to form a bond of measurable strength to another material under conditions of low contact pressure and short contact time. Tack is, thus, not a fundamental material property but depends on the test methods and the conditions of measurement.
The procedure for measuring tack is a two-stage process of bond formation and bond separation. During bond formation, contact in molecular dimensions between the adhesive and the adherend is established by deformation and flow as well as by wetting. The second step, the bond separation with a certain rate, is connected with deformation and crack propagation within the adhesive joint. Adhesion and tack are accordingly related to surface properties and to the mechanical behavior. The latter correlation is the topic of this article.
Experiments
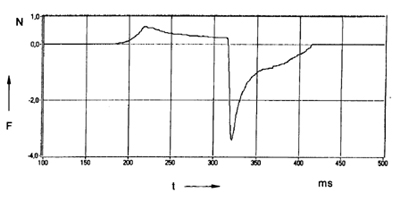
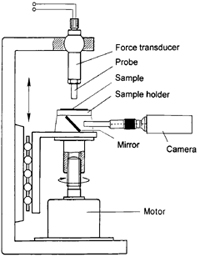
In order to study the effect of the mechanical properties and the deformation behavior on adhesion, an instrument of the probe-tack type was developed in our laboratory a number of years ago [1-3]. The instrument measures the force with time during the whole process of bond formation and separation. The most important parameters during bonding and debonding such as contact time, contact pressure, rate of separation and temperature can be adjusted and measured in sufficiently wide ranges.The primary result of a measurement is a force-vs.-time curve, as shown in Figure 1. The contact force is plotted as positive values and the debonding force as negative values. The strength of the adhesive joint is given by the energy of separation or failure energy per unit of the geometric interface, Ga, which is determined by the integration of the force-vs.-time curve over the separation phase. According to the definition given above, the tack is thus defined as the failure energy under conditions of short contact time and low contact force.
The viscoelastic behavior of the polymers is determined by dynamic mechanical measurements (DMA) with an instrument with parallel plates. With this method, the two components of the complex dynamic shear modulus, the storage modulus G‘ and the loss modulus G“, are determined as a function of temperature and angular frequency.
Viscoelastic Behavior and Adhesion
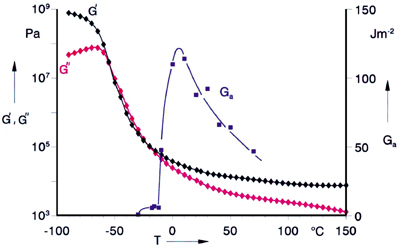
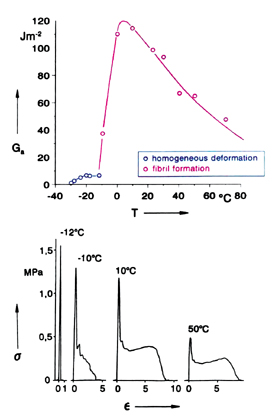
It is well known that the temperature strongly influences the viscoelastic properties of polymers, and the same is true for the adhesion performance. In Figure 2, the components of the dynamic shear modulus and the adhesive-failure energy Ga are plotted vs. temperature for an emulsion polymer of ethylhexylacrylate (PEHA).The dynamic measurements cover the glassy state at low temperatures, the glass-transition range with a strong decrease of both moduli and a temperature range where both moduli decrease with rising temperature more gradually. Just above the glass-transition range, the viscoelastic behavior is governed by entanglements [4]. The storage modulus in this “plateau range” is inversely proportional to the molecular mass between two entanglements, Me, the so-called entanglement length. The gradual decrease over a broad temperature range is typical for a polymer with a certain gel content and a very broad molecular mass distribution, which are often found in polyacrylates from aqueous latices.
The adhesive-failure energy, determined after a contact time of 1 second, shows a maximum in the temperature interval above the glass-transition range. The strong increase of Ga is caused by the fact that the material is more easily deformed with increasing temperature and can develop contact during the short contact time. The decrease of Ga at higher temperatures is connected with the debonding process. It correlates with the general observation that the ability of a polymer to dissipate deformation energy has a maximum in the glass-transition range and decreases at higher temperatures.
The position of the tack maximum is, of course, related to the glass-transition temperature [5]. There are, however, other parameters influencing this position, e.g., molecular mass, crosslinking, etc., so that different samples of the same polymer can show a tack maximum at slightly different temperatures.
Concerning the height of the tack maximum, or more generally the tack level, interesting conclusions can be drawn from Figure 3, which shows the storage modulus G‘ and the adhesive-failure energy Ga for PEHA and a high-molecular-weight polyisobutylene (PIB). Both polymers are similar in various aspects, such as Tg and molecular mass, but have an adhesive-failure energy that is different by more than one order of magnitude.
The reason is the large difference in the storage moduli of both polymers in the plateau range, which is due to a different entanglement length Me in both polymers. Me can be calculated from the storage modulus in the plateau range [6] and is found to be 8,700 g/mole for PIB and about 60,000 g/mole for PEHA.

Micromechanics of Bond Separation
Figure 3 can mislead to the conclusion that there is only a gradual difference between PEHA and PIB due to the different entanglement networks. Investigations of the deformation behavior during debonding, however, demonstrate that this is not the case.
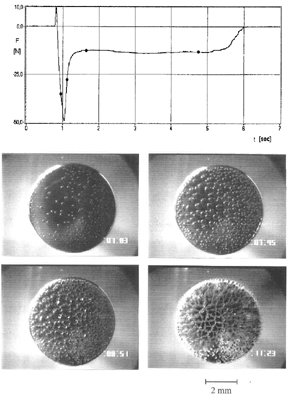
Fibrillation is also observed in peel measurements where it was published for the first time by Kaelble [7] and subsequently studied very extensively by several authors [8,9]. Creton and coworkers have recently developed a similar method as described here in order to study cavitation and fibrillation in probe-tack measurements [10].
The micromechanics of bond separation are strongly affected by temperature and rate of separation [11]. The influence of temperature is illustrated in Figure 7, where we have plotted the adhesive-failure energy Ga vs. temperature for the polyethylhexylacrylate, already shown in Figure 2. One observes a very moderate increase of Ga between -30°C and -10°C, followed by a steep increase by nearly one order of magnitude at higher temperatures. It follows from the stress-vs.-strain curves in the lower part of the figure that this jump in the tack is connected with a sharp transition from deformation without fibril formation below -12°C to fibrillation above -10°C, i.e., in a very narrow temperature interval. This demonstrates clearly that fibrillation is essential for the high tack of PSAs.
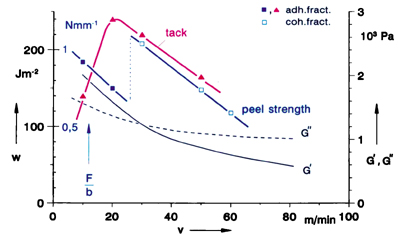
The influence of the rate of separation or the strain rate is very pronounced, too. A sharp transition from fibrillation at low rates to the brittle type of deformation at higher rates is observed [11].

Influence of Molecular Structure
It follows from the preceding sections of this article that the adhesion of soft polymers is governed by their entanglement network. The molecular mass between two entanglements, Me, can be calculated from the so-called plateau modulus GeN0, which is inversely proportional to Me. Ferry summarizes various approaches to evaluate GeN0 [6]. A high-entanglement length is favorable to contact formation as well as bond separation. High values of Me lead to a low-plateau modulus, and that means that the adhesive can more easily be deformed and develop a good contact to the substrate. According to a model of Gent et al., the critical stress for the expansion of pre-existing cavities is also proportional to the modulus [12].The main effect of the entanglement length, however, is its effect on fibrillation or lamellation. Table 1 shows the correlation between fibrillation and the entanglement length Me for some polymers. It follows that polymers with an entanglement length above about 1 x 10⁴ g/mole to 1.5 x 10⁴ g/mole show fibrillation, while materials with an entanglement length below this limit debond by homogeneous deformation. The data in Table 1 shed light on the well-known Dahlquist criterion [13]. Dahlquist found a “definite deterioration of tack” when the modulus exceeds a certain value, which is 3 x 10⁵ Pa for the shear modulus. From this modulus, a molecular mass between entanglements of about 1 x 10⁴ g/mole can be calculated. That means that the Dahlquist criterion is related to the transition from homogeneous to fibrilar deformation. The effect of a tackifier on the tack of natural rubber-based PSAs can also be explained within the framework of this deformation model. Natural rubber is a highly entangled polymer and consequently shows a stress-strain behavior as in Figure 4a. Blending with a tackifying resin increases Me, as shown in Table 1, for a blend with 50% resin. Accordingly, this blend shows fibril formation and high tack.
In spite of the fact that entanglements are crucial for high tack and peel strength, a high entanglement length is not a sufficient condition for good adhesion performance. Other molecular parameters have to be taken into account. One of the most important is crosslinks, owing to their strong influence on the viscoelastic properties of polymers. An appropriate way to test if a polymer is crosslinked or not is to measure the complex shear modulus above the glass-transition range. If G‘ is larger than G“, the sample is crosslinked; if G‘ is less than G“, it is not. The crossover point, G‘ = G“, indicates the so-called gel point [14].
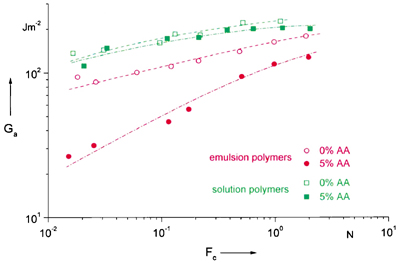
A very interesting phenomena, which seems to have not yet found much attention with exception of styrene-isoprene-styrene (SIS) and similar block copolymers, are two or multiphase structures in polymers and their influence on adhesion. A two-phase morphology is often found in emulsion copolymers of co-monomers with different polarity, which consists of the main polymer within the original latex particles, and a honeycomb-like phase with a high Tg in the interphase and the wedges between the particles. This film structure should influence the mechanics of bond formation and separation.
Conclusions
The investigations summarized in this article demonstrate that measurements of the adhesive-failure energy under well-defined conditions of bond formation and separation lead to a better understanding of the tack of pressure sensitive adhesives. A special deformation mechanism, cavitation followed by fibrillation or lamellation, is crucial for a high tack and a high peel strength. An important macromolecular parameter, which governs this micromechanics, is entanglements. Other important parameters and structures that still deserve more attention are crosslinks, especially the so-called “gel-point structure,” and two-phase morphologies.For additional information on this topic from BASF AG, Ludwigshafen, Germany, e-mail milan.trivunov@basf-ag.de.
Looking for a reprint of this article?
From high-res PDFs to custom plaques, order your copy today!


