SOLVING PSA PROBLEMS
When dealing with complex problems, it is best to take a step-by-step approach. This methodology can aid the investigation of quality issues commonly encountered with pressure-sensitive-adhesive (PSA) products. In the production of pressure-sensitive products, a number of materials are typically brought together: adhesive components are blended or compounded together; release liners are cast and finished prior to being silicone coated; face stocks may be extruded or topcoated and primed; and, finally, all of these components are married in a lamination process. Afterwards, the final base materials are finished, or slit, to size prior to packaging and shipping to a converter. It is quite an involved process for a simple product such as a label or tape to be created.
Most often, this process results in high-quality materials. Occasionally, problems arise and the final product may not meet required specification. To define the nature and extent of the problem, a series of tests must be performed. Routine adhesive testing-such as coating weight/consistency, peel adhesion, tack, and/or shear-can identify adhesive performance issues. However, these tests alone may not lead to the source of the problem and the eventual resolution of a quality issue.
It is up to the investigator to isolate the root cause to a physical/surface-related issue (e.g., contamination) or a bulk adhesive chemistry problem (e.g., improper formulation) while using knowledge of the process and application to solve a problem.
Coupled with common physical tests, certain analytical techniques can be run to form a "roadmap" to identify quality issues. Two of the many possible techniques that can be used are presented in this article: infrared spectroscopy (IR) and thermo-gravimetric analysis (TGA). These techniques, among others, are good starting points for analytical testing.
Infrared Analysis (IR)
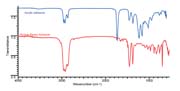
Molecules above absolute zero temperature (-296°C) are in constant motion (e.g., vibrations, rotations, etc.). Molecular vibrations that result in a non-zero dipole moment occur at frequencies in the infrared region of the electromagnetic spectrum. The exact vibrational frequencies depend upon the masses of the atoms involved and their bonding. These two criteria are commonly coupled together in the term "functionality." Detection of what functionalities are present in a sample is possible by irradiating the sample with IR light and monitoring what frequencies are absorbed. Correlation charts of IR frequency and functionality have been painstakingly developed by spectroscopists and are widely available. IR is not a good quantitative tool, as detection is limited to approximately 3-5% by weight.IR is one of the most frequently used analytical tools for quality analysis. Most applications compare lots of the same material or compare unknown material to database spectra. An example to illustrate this involves comparison of IR spectra of a rubber-based adhesive to an acrylic adhesive (see Figure 1).
As can be seen from the overlaid spectra, there are different frequencies of IR energy that are absorbed in a rubber-based adhesive as opposed to an acrylic adhesive due to the different functionalities present.
A powerful feature of IR is that it is an additive technique. In other words, if a sample contains three IR-active components, the IR spectrum of the sample will appear like an overlay of the spectra of the three separate IR-active components. Therein lies the ability to ascertain presence or lack thereof of IR-active components or impurities in a sample. An attractive feature of IR spectroscopy for the adhesives/coatings industry is the ability to analyze the surface of a material (up to 2 x 10⁻⁶ meters deep). The apparatus to make this possible involves a crystal with proper refractive index properties (zinc selenide is most common). The sample is placed on the surface of the crystal with minimal pressure to ensure good contact. IR light is then used to probe the sample surface in one or multiple spots.
IR can be used for qualitative comparisons of different lots of the same material (or unknown materials) to databases, and to detect the presence (or lack thereof) of components or impurities in a sample. Disadvantages of IR spectroscopy are detection limit, non-IR active components and the possibility of samples possessing similar IR spectra. Examples of the last disadvantage include comparing IR spectra of n-octane to n-nonane, or comparing spectra of different molecular weights to the same polymer.
Thermo-Gravimetric Analysis (TGA)
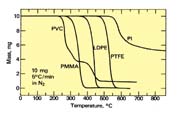
TGA examines the decomposition mechanism(s) of a sample by monitoring changes in mass with increasing temperature. This technique has been used to study decomposition, as well as other mechanisms. TGA involves placing tens of milligrams of a sample on a specialized analytical balance housed inside a precise temperature-controlled oven. As the temperature is increased, components present in the sample may decompose, leading to decreases in sample mass. Through the aid of user-constructed databases, qualitative identification can be made based on the component's maximum rate of decomposition temperature and decomposition profile. Since the mass of the sample is continually monitored during analysis, quantitative data is gathered in terms of weight percentage of a decomposed component. Obvious disadvantages of the technique are its destructive nature and the careful adherence to parameters for comparison to user-created databasesTGA can be used to investigate presence (or lack thereof) of components and/or impurities, as well as present quantitative information. Example of TGA profiles of various polymers is presented in Figure 2. The two techniques described herein offer different types of information about pressure-sensitive products and materials. There are many more advanced analytical techniques available to study PSAs and coatings. These two techniques offer a good starting point for coupling to physical data. It is easy to see how information relating to the structural makeup or physical proportions of ingredients can point to possible reasons for lack of product performance. While routine peel, tack and shear can expose a problem, it is the analytical work that shows what may have gone wrong.
For more information on analytical testing, visit www.chemsultants.com.Looking for a reprint of this article?
From high-res PDFs to custom plaques, order your copy today!


