Enabling Innovation in the Chemical Industry: A Novel Approach

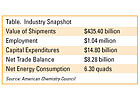
Chemical Industry Landscape
In general, the chemical industry trades on two broad classes of products: bulk and specialty chemicals. The bulk chemicals market is characterized by low margins and high volumes, and specialty chemicals are generally produced in lower volumes and command higher prices. Most chemical companies have refocused their R&D efforts and sustainable growth strategies over the past few years to keep pace with the changing business landscape. For example, in 2001, while referring to the chemical industry in general, then Dow Chemical Co. Chairman William S. Stavropoulos was quoted on http://www.acs.org 3 calling for revitalizing R&D as an engine for growth. In 2005, Dow had a record growth in net income of 61% over 2004.4 In 2002, DuPont reorganized its R&D activities. DuPont's revenues resulting from new products increased from 20% in 2000 to 30% in 2004. Over this time period, DuPont's R&D expenses remained steady at $1.3 billion.5 The key to such successes was the increased focus on innovation in R&D.In addition to benefiting from R&D, the chemical industry continues to invest in and benefit from technology solutions in the areas of energy optimization, production efficiency, reduction of downtime, reactor scale-up and troubleshooting.2
CFD in the Innovation Process
Whether it is tuning of solvents in an ink-jet printing technology, mixing of miscible fluids, scaling up reactors, or any of the dozens of other areas where CFD is applied, innovation is influenced and facilitated by flow modeling. Technical advances contributing to the wider use of simulation tools have progressed in two distinct directions. Firstly, more complex and reliable physical models have evolved rapidly in recent years. Secondly, CFD analysis has been extended to non-expert users through the deployment of custom desktop and enterprise software tools that are based on CFD. The latter trend has permitted smaller chemical companies to make use of flow modeling and larger entities to take full advantage of the power of the technology by deploying its use throughout the organization.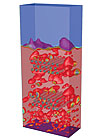
Gas-Solids and Particulate Flows
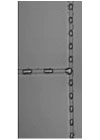
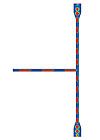
CFD methods that account for the presence of secondary phases are well established. Recent advances in such methods now enable simulation of flows with very high solid loading, such as hoppers, chutes and particle milling, and also gas-solid flows with particle size and number density variations, such as polymerization reactors. The effect of particle shapes and particle mechanics can be accurately captured in CFD models. It is now possible to gain insight into the fates of individual particles. Calculation of particle motion, particle size, bed porosity, particle-particle interaction and other hydrodynamic concerns is currently tractable. More advanced models can account for particle cohesion, attrition and other prescribed phenomenological attributes.Gas-solid reactors commonly include an internal tube bank to control the flow and add heat and/or gas to the bed. The presence of the internal tube banks alters the flow patterns and can cause the bubbles in the bed to collide, leading to coalescence or break-up. Three-dimensional simulations of reactor beds are desired to achieve a good understanding of the effects of the internals, as well as to assess possible erosion rates on the walls and components.
Insight into reactor performance through such models significantly improves reactor performance and efficiency, and therefore improves a company's bottom line. For example, reactor designs can be modified to reduce erosion, and thus improve equipment safety. Improving equipment safety reduces the possibility of the economic penalties that might be incurred through lawsuits and bad publicity associated with accidents. Additionally, extending the life of equipment allows higher product volumes without having to replace the equipment as often, saving considerable cost.
Figure 1 shows a snapshot of a time-dependent simulation of a rectangular cross-section fluidized bed including two sets of tube banks. Iso-surfaces of gas-volume fraction (shown in red) illustrate that gas bubbles formed within the bed are broken up as they pass through the tube banks, but not where they pass around the sides. With increased confidence in models for dense bed fluidization, the knowledge gained about the distribution of the gas-solid volume fractions helps in debottlenecking design and operation issues. A recent publication by Derek Colman from British Petroleum addresses many of these issues like fluidization, variation in drag, bed effective viscosity, solids pressure and heterogeneous chemical reactions.6
Designing Size Distribution in Micro-Emulsions
Tailoring real-life complex fluids (such as emulsions) to achieve specified target properties is an active business driver in the chemical industry. The properties of such emulsions are based on the droplet size distribution (DSD) of the dispersed phase. Because they are often thermodynamically metastable, there is a persistent threat that the texture of the emulsion will be altered during the course of preparation or packaging, or during the subsequent shelf life. Many processes over widely varying length scales could cause the DSD to change, and it is important that they be well understood so that the emulsion quality can be maintained.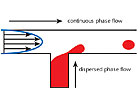

Courtesy of Dow Chemical Co.
Crystallization in Stirred Tanks
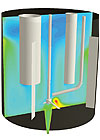
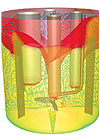
One of the main challenges in industrial crystallizers is to control the crystal size distribution (CSD). CSD control is important to ensure product quality and purity and the successful operation of the crystallizer. It often affects downstream processing such as filtration, centrifugation and milling. In spite of its importance, CSD is not well understood. Part of the difficulty is that the size distribution varies in space and time in a crystallizer due to non-ideal flow patterns and heat transfer. Solution thermodynamics and crystallization phenomena also play a role.Process time scale, reactor opacity, and the inconvenience and intrusive nature of in-situ experimental assessments are some of the formidable obstacles that prevent full understanding of the process dynamics within the crystallizer stirred tanks. CFD is an attractive alternative approach to understanding the hydrodynamics. However, it requires additional capabilities to account for the coupled effects of fluid mechanics and crystallization phenomena in order to analyze the crystal population balance in the tank. The crystal population balance alters the local fluid properties and hence the hydrodynamics, which in turn influence the CSD. Population balance models that quantitatively monitor nucleation, growth, dissolution, aggregation and breakage make it possible to account for the coupling between the CSD and hydrodynamics.
Courtesy of Dow Chemical Co.
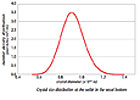
The Eulerian granular multiphase model in the CFD software was used in conjunction with the population balance solver. The rotation of the impeller was simulated using the multiple reference frames (MRF) approach. The constituents NaCl, CaCl2 and KCl in water were each modeled as a species in the primary phase. The vessel had a curved feed tube, baffles on the walls and two dip filter cartridges where clarified liquor was removed by collecting crystals on their surfaces. Results showed that as the NaCl solute entered the cooler reactor, it was quickly consumed to form crystals. At the outlet, the mass fraction of NaCl in solution was 0.37%, compared to 1% at the inlet, indicating a purification of the solution. The solids volume fraction showed some settling and collection at the outlet filter. At the bottom of the crystallizer, the amount of solids was 3% and the Sauter mean diameter of the crystals was 133.8 microns, almost 10% larger that the size at the inlet. Results show that the region containing the maximum number density of the crystals is located close to the inlet where there is ample supply of solute and a high supersaturation ratio. The crystal size distribution at the outlet is in good qualitative agreement with observations.
Courtesy of Dow Chemical Co.

Custom Tools for Process Engineers
The basic requirement of custom analysis and visualization tools for process engineers is to ensure that these tools are able to provide reliable, predictive answers to various "what-if" scenarios for design and operational changes of equipment or processes. The most important benefit of using these tools, aside from their ability to provide answers to a specified problem, is that they eliminate user errors. This allows process engineers with their focused domain knowledge to handle these tools flawlessly without needing to learn the intricacies of flow modeling, thus eliminating any formal CFD learning curve. The end result is increased equipment uptime, reduced time to market and reduced development costs.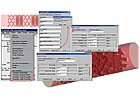
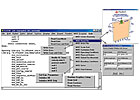
Figures 9-10 show two other similar custom tools for in-line mixers and magneto-hydrodynamic simulators, respectively.
Summary
Progress in both software and hardware has now enabled CFD tools to reach throughout the chemical industry for both developmental and troubleshooting applications. There are numerous business benefits to using flow modeling technology, including the following.- Increased profitability through improved operating efficiency.
- Increased revenue through higher process throughput.
- Increased profitability and revenue through reduction of planned and unplanned maintenance costs.
- Faster time to market through more effective scale-up of new process prototypes, leading to competitive advantage and increased revenues.
- Timely and cost-effective troubleshooting of flow-related problems leading to reduced operating costs, increased operational uptime and, ultimately, increased revenues.
About ANSYS Inc.
ANSYS Inc., founded in 1970, develops and globally markets engineering simulation software and technologies widely used by engineers and designers across a broad spectrum of industries. The company focuses on the development of open and flexible solutions that enable users to analyze designs directly on the desktop, providing a common platform for fast, efficient and cost-conscious product development, from design concept to final-stage testing and validation. The company and its global network of channel partners provide sales, support and training for customers. Headquartered in Canonsburg, PA, with more than 40 strategic sales locations throughout the world, ANSYS and its subsidiaries employ approximately 1,400 people and distribute ANSYS products through a network of channel partners in over 40 countries.About Fluent Inc.
Fluent Inc. is a wholly owned subsidiary of ANSYS, Inc., (NASDAQ: ANSS), the world's largest provider of computational fluid dynamics (CFD) software and consulting services. Fluent's software is used for simulation, visualization and prediction of fluid flow, heat and mass transfer, and chemical reactions. It is a vital part of the computer-aided engineering (CAE) process for companies around the world and is deployed in nearly every manufacturing industry. Using Fluent's software, product development, design and research, engineers build virtual prototypes and simulate the performance of proposed and existing designs, allowing them to improve design quality while reducing cost and speeding time to market.ANSYS, ANSYS Workbench, CFX, AUTODYN, FLUENT and any and all ANSYS, Inc. product and service names are registered trademarks or trademarks of ANSYS, Inc. or its subsidiaries located in the United States or other countries. ICEM CFD is a trademark licensed by ANSYS, Inc. All other trademarks or registered trademarks are the property of their respective owners.
SIDEBAR: Margin of Victory
CFD-based strategies allow chemical & process companies to improve revenue growth (top line) while lowering costs (improve bottom line) through:- Enhanced operating performance
- Better unit operation reliability
- More confident process scale-up
- Enhanced product consistency
- Increased plant productivity
- Deeper technical knowledge and understanding of unit processes
- Lower equipment downtime for maintenance
- Compliance with health, safety and environmental regulations
Links
Looking for a reprint of this article?
From high-res PDFs to custom plaques, order your copy today!


