The Global Formulated Adhesives Market

After years of uninterrupted growth, adhesive demand fell 5% in 2009 as the global recession took its toll. Global GDP declined by about 1% in 2009 and industrial production was off by nearly 3%. Formulated adhesive consumption in 2009 was 16.6 billion lbs (worth $20.6 billion). Volume is forecast to expand at a 4.5% annual rate through 2014 as the global economy rebounds. Growth in emerging economies will be robust, while modest increases in the mature economies of Europe and North America are forecast. Formulated adhesive consumption varies from over $12 per capita in the European Union and North America to less than $3 per inhabitant in China, India, and Brazil.
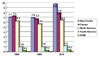
Figure 1. Adhesive Consumption by Region ($ Billion)
Regional Overviews
The Asia-Pacific region is the largest consumer of formulated adhesives; it achieved 40% of the 2009 volume and 34% of the dollars. Regional volume was up slightly in 2009 compared to the prior year, while the sales value was slightly lower. China is the largest consumer in Asia-Pacific with 53% of the volume and 49% of the value. Chinese adhesive consumption was up 6% in 2009 as the domestic economy expanded, despite weak export demand for its manufactured products. A robust 9% annual rate of growth is forecast for adhesives in China.Japan, the second-largest market for adhesives in the region, took 16% of the 2009 volume and one-fifth of the dollars. Volume in Japan declined significantly compared to 2008, and lackluster growth is forecast. India is a smaller user of adhesives, with 6% of the regional volume and 5% of the value. Like China, it is one of the few countries in the world to have experienced modest adhesive growth in 2009. Adhesives in India are projected to expand 11% per year through 2014.
Europe is the second-largest regional consumer of formulated adhesives, with 30% of the world’s volume and 32% of the value in 2009. Europe had been the leader in adhesive dollars prior to 2009. The sharp decline in European consumption allowed the Asia-Pacific region to capture the lead, which is projected to widen in future years. A 3% annual growth rate is forecast for European adhesives, with Eastern European countries expanding somewhat faster than Western Europe. European Union members consumed about 93% of the adhesive dollars.
North America took 24% of the global adhesive volume in 2009 and 27% of the dollars. As was the case in Europe, the market declined significantly from 2008. The U.S. consumed nearly 90% of the regional total, with the rest about equally split between Canada and Mexico. A modest 3% annual rate of growth is forecast for North American adhesive volume. South and Central American countries consumed 5% of the global adhesive volume and dollars in 2009. Brazil is the leading regional consumer with 57% of the value. Brazil weathered the global recession better than most, with adhesive volume only down 2% in 2009. South and Central American adhesives are projected to advance 5% annually through 2014.
Figure 1 shows adhesive dollar consumption by region in 2008 and 2009, as well as the 2014 forecast.
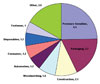
Figure 2. Adhesive Consumption by End Use, 2009. ($20.6 Billion Total)
End Use Review
Pressure-sensitive products are the largest adhesive end use, representing 28% of the global volume in 2009 and 25% of the value. Applications include tapes, labels, decals and a host of other specialty products. Over 45 billion m2 of product is adhesive-coated, with tapes comprising over 60% of the total. Two-thirds of the adhesive value is produced in-house by pressure-sensitive product manufacturers. Pressure-sensitive adhesives are forecast to grow 5% annually through 2014, with emerging economies (China, India, Brazil, etc.) expanding faster.Packaging is the second-largest end use, with 22% of the volume and 18% of the dollars in 2009. Global volume was down only slightly from the prior year and a 4% annual rate of increase is forecast. Flexible packaging is a higher value segment that represents one-quarter of the packaging adhesive dollars in 2009. Construction was the third-largest adhesive outlet in 2009, with 16% of the volume and 10% of the dollars. Construction adhesive applications include ceramic tile and flooring installation, pipe cements, roofing, wall coverings, etc. Volume was down more than 10% compared to 2008, as activity declined significantly in the mature economies.
Woodworking is the fourth-largest end use, taking 11% of the 2009 volume and 8% of the dollars. Wood furniture is a leading application, and global production suffered the effects of the recession. The automotive industry is the fifth-largest end use in dollars, with a 6% share despite representing only 2% of the dollars. Adhesives consumed by car and truck manufacturers are included, as well as those used in the aftermarket. Global vehicle production was 61 million units in 2009, which was down 13% compared to 2008. Steep declines occurred in Europe and North America. In contrast, production in Asia-Pacific remained about the same as output surged in China. Some 810 million vehicles are on the world’s roads, with adhesives used by both the professional and consumer. Excluded from automotive adhesives are windshield sealants, a nearly $600 million market in 2009, as well as several other sealant types.
The five largest adhesive applications took 80% of the adhesive volume in 2009 and two-thirds of the value. Figure 2 shows adhesive consumption by end use in dollars for 2009. Electronics, bookbinding, and aerospace are larger end uses in the “other” category.
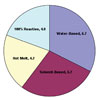
Figure 3. Adhesive Consumption by Technology, 2009 ($20.6 Billion Total)
Adhesive Technologies
Figure 3 summarizes the four major adhesive technologies in value for 2009. Water-based adhesives are the leading type, with $6.7 billion consumed (33% of the global adhesive sales dollars). Water-based adhesives are generally lower in cost and they represented over one-half of the 2009 pounds.Solvent-based technology is second in dollars, with its $5.7 billion (28%) of the value. Hot-melts were third, representing one-fifth of the dollars, with packaging and disposable products leading outlets. The 100% reactive category was slightly behind hot-melts in dollars, with a 19% share. These products are generally the highest priced adhesives, and they captured only 4% of the volume. Epoxy, polyurethane, cyanoacrylate, anaerobic, structural acrylic, etc. products are included.
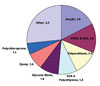
Figure 4. Adhesives Consumption by Type, 2009 ($20.6 Billion Total)
Adhesive Types
Adhesives employ a host of polymer types in their formulation. Sales of the leading adhesives by polymer type in 2009 are shown in Figure 4. Acrylics are topmost, with their $3.6 billion in sales representing a 17% share. Acrylic emulsion-based formulations were 72% of the dollars and solvent-based acrylics accounted for 23%. Smaller amounts of structural acrylics and radiation-cured hot-melts are used. Water-based polyvinyl acetate (PVAC) and vinyl acetate-ethylene (VAE) adhesives comprised 14% of the adhesive dollars. Woodworking and packaging are the larger outlets.Polyurethane adhesives were 12% of the sales and are formulated using each of the four major technologies. Solvent-based formulations were one-half of the polyurethane dollars, with flexible packaging and footwear the largest applications. The 100% reactive polyurethanes were about one-third of the dollars, with flexible packaging and automotive its major outlets. Hot-melt polyurethanes were 10% of the sales and water-based formulations another 7%.
Ethylene-vinyl acetate (EVA) and polyethylene hot-melts were 9% of the adhesive dollars in 2009, as were styrenic block copolymer hot-melts. Packaging is the major user of EVA and polyethylene hot-melts. Some 95% of the styrenic block copolymer adhesives are used in pressure-sensitive products and disposable products (diapers and other).
Epoxy adhesives are used in several higher dollar value end uses, which include the electronic, aerospace and automotive industries. Polychloroprene adhesives are largely solvent-based, although water-based versions have gained share in recent years. Footwear, woodworking and construction are the larger outlets. Larger dollar value adhesives included in “other” are cyanoacrylate, anaerobic, rubber, starch and dextrin, polyester, and polyamide.
Competitive Outlook
Acquisitions continue to alter the adhesive supplier structure. In 2009, the top 20 formulated adhesive suppliers captured 47% of the sales value. These companies sold about 55% of the adhesives in North America, Europe, and South and Central America. Their share in the Asia-Pacific region was only about one-third of the total, but it is expected to rise.Many adhesive suppliers augment their sales with related products, which can include sealants, binders, construction products, electronic potting and encapsulating compounds, coatings, etc. Although the supplier base in large-volume end uses is concentrated, the wide range of end users, applications and technologies yields thousands of suppliers and an environment where novel technologies thrive.
The above information is based on The Global Adhesives Industry, a new study by Steven Nerlfi, Minesh Kusumgar, and Michael Growney. For more information, phone (201) 773-0785, e-mail nerlfikng@cs.com or visit www.kusumgar-nerlfi-growney.com.
Links
Looking for a reprint of this article?
From high-res PDFs to custom plaques, order your copy today!


