State of the U.S. Construction Market
Construction and building-related end uses make up approximately 25% of the market value for adhesives and sealants in the U.S.
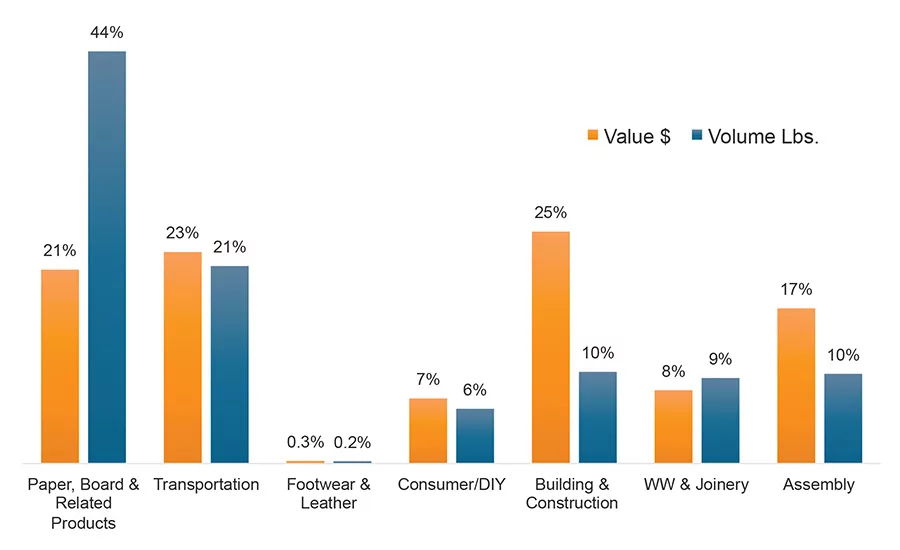
Figure 1. 2017 North American adhesives market volume and value.
Source: The ChemQuest Group Inc.

Figure 2. Total U.S. construction, 2010-1017.
Source: U.S. Census Bureau

Figure 3. Dodge Momentum Index.
Source: Dodge Data
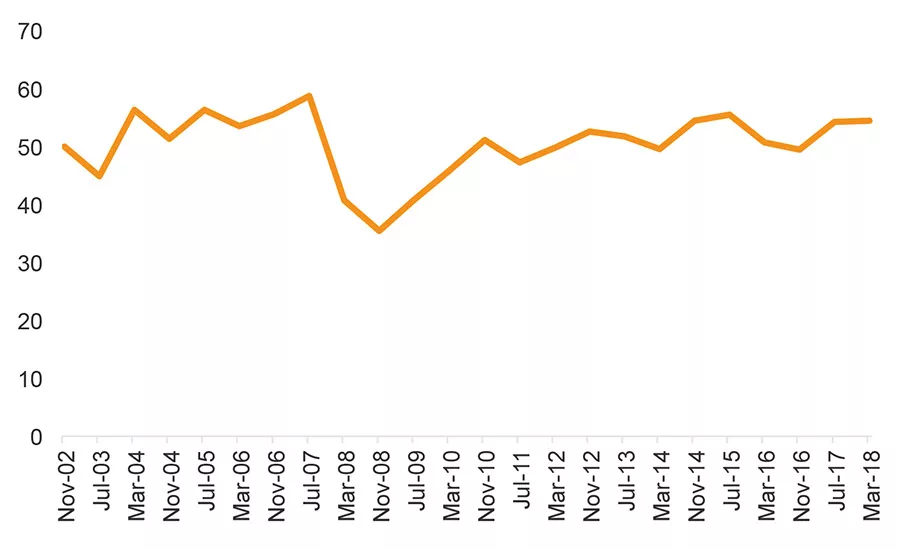
Figure 4. The Architectural Billing Index.
Source: American Institute of Architects
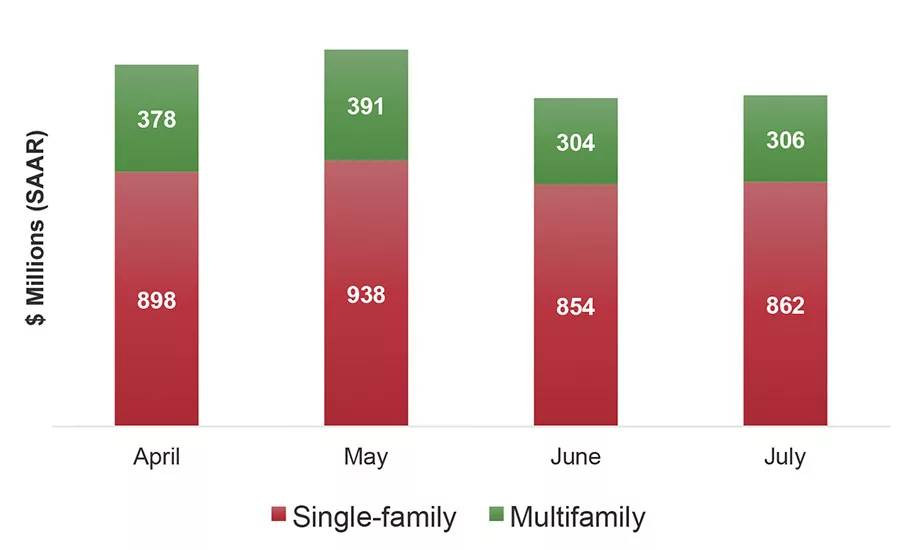
Figure 5. Housing starts, April-July 2018.
Source: U.S. Census

Figure 6. Leading indicator for single-family residential housing.
Source: National Association of Home Builders

Figure 7. Home improvement, 2015-2019.
Source: U.S. Census
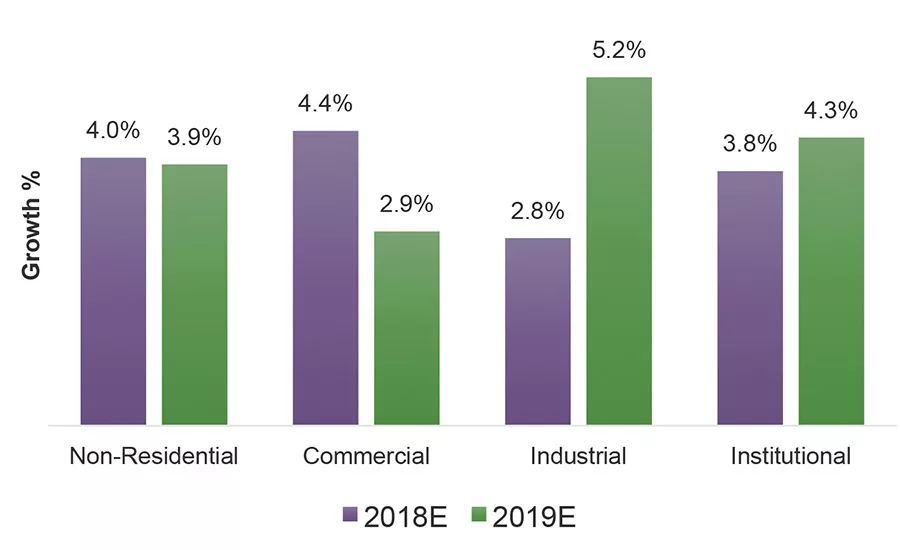
Figure 8. AIA Consensus Construction Forecast (2018, 2019).
Source: American Institute of Architects (AIA) Consensus Construction Forecast
The global market for adhesives and sealants in 2017 reached 34 billion dry lbs, valued at $59 billion. North America represented approximately 30% of the global market. Construction and building-related end uses make up approximately 25% of the market value for adhesives and sealants in the U.S., with about 70% of adhesives and sealants consumed on location in new construction and repair (see Figure 1).
By share, reactive adhesives (primarily for civil engineering applications) represented the largest segment, with 42% demand. Water-based adhesives follow closely at 34% demand share, and the remaining share is divided between solvent-based adhesives (9%), hot melts (9%), and pressure-sensitive adhesives (6%).
U.S. Construction
Residential and non-residential construction split at 60/40%, respectively. The average growth in total construction spending has been a robust 7.9% over the last five years. Dodge Data & Analytics expects a 3% increase of 2018 total construction starts over 2017. Within non-residential, institutional (up 3%) and commercial (up 2%) are projected to have the highest growth rate. Manufacturing starts are forecasted to decrease by 1%.
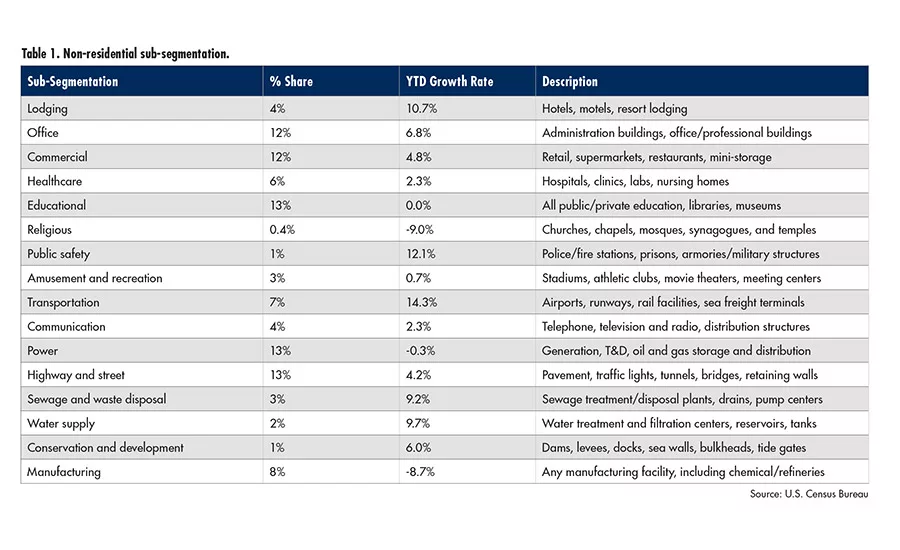
Non-Residential Construction Spending
Non-residential construction spending decreased slightly, down 0.5% in 2017, according to the U.S. Census Bureau. The non-residential construction market is a fragmented market with numerous subcategories and sectors. Non-residential leading indicators are shown in Table 1. The Dodge Momentum Index remains strong, rebounding after a temporary dip in mid-2017 (see Figure 3).
Residential Construction Spending
Over the past eight years, new residential construction has seen a slow, steady recovery, growing at an average rate of 10% annually. Residential construction remains only 85% of its peak in 2006 (nominal dollars).
Both single- and multi-family housing starts have recovered from their lows of 550,000/year at the end of 2008 to a forecasted 1.3 million for 2018. In 2017, existing home sales were 1.7% higher than 2016, with 5.51 million units sold. By comparison, new home sales soared 9.3% in 2017, with 613,000 thousand units sold. Employment gains, coupled with a low inventory of existing homes (especially starter homes), drove up both home prices (up 6.2% from June 2018 over June 2017). Increasing interest rates (4.5% for 30-year mortgages) also contributed.
The most recent data show that housing starts have been soft; July housing starts failed to reverse the outsized June decline. In June, starts of both single- and multi-family units fell sharply.
Home ownership rates have stabilized but are still low, particularly among millennials, compared to the historical average of people ages 25-34. Currently, 64.3% of Americans own their own house, up from its lowest level of 62.9% in 2016, but well below the peak of 69% in 2005.
As of July, the construction industry’s unemployment rate is 3.4%, slightly lower than the current overall rate of 3.9%. A persistent labor shortage has driven up costs for builders following a significant loss of skilled workers who left the construction field for other opportunities during the economic downturn. Another cost driver affecting builders is the upturn in the cost of materials, especially softwood lumber, which peaked in May and is up more than 50% over the previous year.
Residential Leading Indicators
The National Association of Homebuilders’ (NAHB) leading indicator for single-family residential housing) is still trending upward (see Figure 6). The residential remodeling market continues to flourish. Remodeling includes both improvements and maintenance and repairs. Historically, spending is split 80/20 in favor of improvements vs. maintenance.
Although remodeling projects use less adhesive than new construction, remodeling is still an area of significant adhesive demand. The long-term trend of homeowners moving away from do-it-yourself (DIY) and hiring others for projects has resumed after reversing a bit during the recession. Remodeling spending is expected to peak at approximately $350 billion in 2019 (Harvard Joint Center on Housing).
Looking Forward
The American Institute of Architects (AIA) provides a consensus construction forecast. In recent years, these forecasts have tended to be overly positive on forward growth prospects and often don’t match the commentary or sales data that are disclosed by manufacturers. The current 2019 over 2018 consensus forecasts steady non-residential growth at 3.9% and 4%, respectively.
Management and investment consultancy firm FMI expects spending growth in 2018 to be led by select non-residential and residential segments. The current top-three-performing segments forecast in 2018 include transportation (+10%), residential improvements (+9%) and office (+9%). The bottom-three-performing segments include power (-1%), sewage and waste disposal (+1%), and religious (+2%).
Michael Rezai is a consultant at The ChemQuest Group Inc. For more information, visit www.chemquest.com.
Looking for a reprint of this article?
From high-res PDFs to custom plaques, order your copy today!


