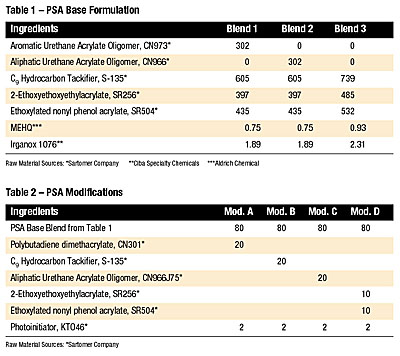
Physical Property Modifications in UV-Curable, Pressure Sensitive Adhesives
Traditionally, PSA formulations have been solventborne and based upon modified rubber chemistry. Due to today’s stricter environmental-compliance regulations, these solventborne PSAs are being challenged by low-VOC, fast-curing systems such as ultraviolet (UV) and electron beam (EB).
For more than 10 years, chemists have researched UV/EB-cure PSAs. Research has shown the types of oligomer and monomer structures that will produce an acceptable UV/EB-curable PSA(#1-6). Initial research yielded the best monomers to achieve low-odor and low-viscosity UV/EB-curable PSAs(#1). Optimizing the tackifier and Tg to yield best UV/EB-cured PSA performance(#2), followed by optimizing the oligomer structure(#3-6), leads the industry in a positive direction in the development of UV/EB-curable PSAs. Studies have shown that excellent peel strengths have been obtained with acrylate-terminated oligomers with molecular weights ranging from 1,000 to 6,000, and glass transition temperatures ranging from -74 degrees C to 13 degrees C.
Recently, Sartomer chemists investigated three UV-curable PSA formulations (Table 1), making four modifications to each PSA to vary performance for various reasons (Table 2). In the first variation, polybutadiene dimethacrylate was added to try and improve shear adhesion failure temperature (SAFT). The second variation contained additional hydrocarbon resin, commonly used to reduce cost. The third variation contained additional urethane acrylate oligomer to improve adhesion. The fourth variation contained additional monomers to reduce viscosity. For all of these PSAs, including the base PSAs, viscosity profiles, 180 degrees-peel adhesion, tack and SAFT, tests were all run to help better understand performance.
Viscosity Profiles
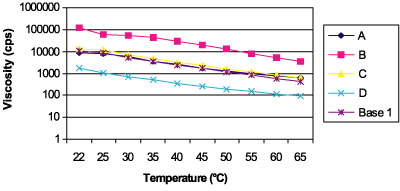
For each of the three base PSA blends, four different dilutions were made for reasons described previously. Each dilution with the original base blend PSA has a viscosity profile run from room temperature to 65 degrees C. Base blend #1 results are shown in Figure 1.Modification A (CN301 – polybutadiene dimethacrylate), modification C (CN966J75 – aliphatic urethane acrylate), and the base PSA blend all have similar viscosity profiles, whereas modification B (Norsolene S-135) has by far the greatest viscosity, as expected. The addition of more monomers in modification D lowers the viscosity significantly where the 25 degrees C viscosity is around 1,000 cps.
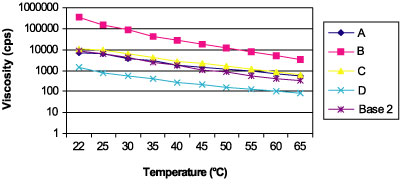
Base blend #2 is similar to base blend #1, except that a different oligomer is used. Base blend #1 used an aromatic urethane acrylate, whereas base blend #2 used an aliphatic urethane acrylate. Base blend #2 results are shown in Figure 2. Again, the same trends were observed with the same modifications that are in base blend #1.
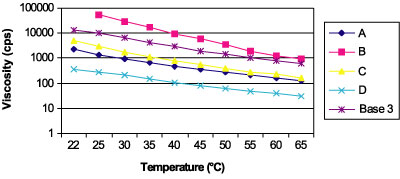
Base blend #3 has no oligomer in the formulation. This blend was studied as a lower-cost UV/EB-curable PSA. The viscosity profiles for base blend #3 with various modifications are shown in Figure 3.
For base blend #3, the base formulation viscosity is higher than all of the modifications except for the addition of hydrocarbon resin, modification B. However, it appears that the D modification still has the lower viscosity, with the 25 degrees C viscosity of about 290 cps.
The color and density were measured for all of these samples. All were in the range of a Gardener Color of 5-6, except those containing the CN301 polybutadiene dimethacrylate, which is a darker oligomer. All of the samples yielded a density of 8.7-8.8 lb/gal.
Evaluating 180 degree Peel Adhesion
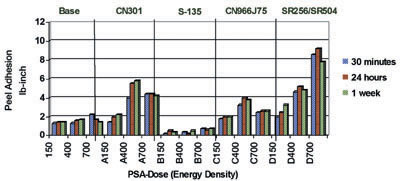
Each of the modifications – plus the base blend – was coated onto Mylar and cured at three different doses or energy densities: 150, 400 and 700 mJ/cm2. The first step in evaluating this data is to look at the 180o peel adhesion. Each of the blends was fully evaluated with each of the four modifications for the 180 degree peel adhesion for 30 minutes, 24 hours and one week after UV cure. The results for blend #1 are shown in Figure 4.The first three groups of bars in the graph represent the base PSA cured at three different doses, 150, 400 and 700 mJ/cm2, and tested under the aging conditions. The second grouping, the “A” PSA, which has 20 percent CN301 (polybutadiene dimethacrylate) added into the PSA blend, has higher 180 degree peel adhesion than the base PSA blend. With the third grouping, the 20 percent addition of S-135 hydrocarbon resin into the base PSA, the 180 degree peel adhesion significantly decreases. The fourth grouping evaluates the 20 percent addition of CN966J75, an aliphatic urethane acrylate oligomer. The 180 degree peel adhesion is improved over the base PSA. As for the final group, the 20 percent addition of the SR256 (2-ethoxyethoxyethylacrylate) and SR504 (ethoxylated nonyl phenol acrylate) in a 1:1 blend, the results for the 180 degree peel adhesion are greatly improved over the base PSA.
The results for blend #2 are similar to those in blend #1. Both contain a urethane acrylate oligomer; blend #2’s is an aliphatic urethane rather than the aromatic in blend #1.
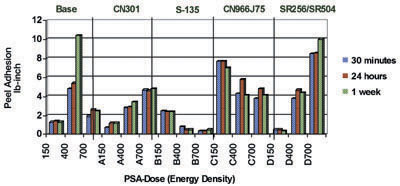
For blend #3, the 400 mJ/cm2 results are much higher than the 150 and 700 mJ/cm2 results (Figure 5). The second grouping, the “A” PSA, which has the 20 percent CN301 polybutadiene dimethacrylate added into the PSA blend, has slightly better 180 degree peel adhesion than the base PSA blend – except in this case, the 400 mJ/cm2 results follow the observed trend. With the third grouping, the 20 percent addition of S-135 hydrocarbon resin into the base PSA, the 180 degree peel adhesion decreases, this time with additional UV dosage reducing the 180 degree peel adhesion. The fourth grouping evaluates the 20 percent addition of CN966J75, an aliphatic urethane acrylate oligomer. The 180 degree peel adhesion has greatly improved compared to the base PSA, although again we see that the increase in dose actually decreases the 180 degree peel adhesion. In the final group, the 20 percent addition of the SR256 (2-ethoxyethoxyethylacrylate) and SR504 (ethoxylated nonyl phenol acrylate) in a 1:1 blend, the results for the 180 degree peel adhesion are improved over the base PSA only for the 700 mJ/cm2 sample.
Evaluating Tack
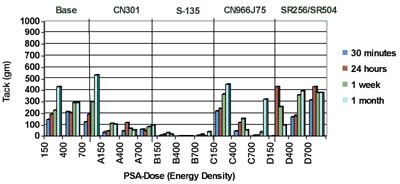
Tack was run in a similar manner to peel adhesion, in which aging the samples shows long-term stability or lack thereof. Sartomer scientists reviewed all the above samples and tested tack with the aging of the samples, along with a one-month aging sample. Each of the blends was fully evaluated for tack 30 minutes, 24 hours and one week after UV cure. Shown in Figure 6 are the tack results for PSA blend #1 with the modifications.The first three groups of bars in the graph represent the base PSA cured at three different doses –150, 400 and 700 mJ/cm2 – and tested under the aging conditions. The second grouping, the “A” PSA, which has 20 percent CN301 polybutadiene dimethacrylate added into the PSA blend, has lower tack than the base PSA blend and diminishes with increased dosage. In the third grouping, which is the 20 percent addition of S-135 hydrocarbon resin into the base PSA, we see that tack is non-existent. The fourth grouping evaluates the 20 percent addition of CN966J75, an aliphatic urethane acrylate oligomer. The tack has slightly improved over the base PSA. In the final group, the 20 percent addition of the SR256 (2-ethoxyethoxyethylacrylate) and SR504 (ethoxylated nonyl phenol acrylate) in a 1:1 blend, tack is greatly improved over the base PSA, primarily for the 400 and 700 mJ/cm2 dose.
In base blend #2, the PSA has a relatively low tack of 100-200 grams in most of the samples (only slightly higher than the first blend). The “A” PSA, which has 20 percent CN301 polybutadiene dimethacrylate added into the PSA blend, has lower tack than the base PSA blend; it decreases as the dose increases. Again, in looking at the 20 percent addition of S-135 hydrocarbon resin into the base PSA, tack is non-existent. Evaluating the 20 percent addition of CN966J75, an aliphatic urethane acrylate oligomer, shows that the tack is lower than the base PSA, although the 700 mJ/cm2 samples yield slightly better results than the base PSA. Finally, the 20 percent addition of the SR256 (2-ethoxyethoxyethylacrylate) and SR504 (ethoxylated nonyl phenol acrylate) in a 1:1 blend shows that the results for tack are again greatly improved over the base PSA; it increases as the dose increases.
The first three groups of bars in Figure 7 represent the base PSA cured at three different doses – 150, 400 and 700 mJ/cm2 – and tested under aging conditions. For base blend #3, tack results are higher than for the other two bases. It appears that tack increases with age. In the second grouping, which has the 20 percent CN301 polybutadiene dimethacrylate added into the PSA blend, tack is lower than with the base PSA blend. Again, the third grouping, which is the 20 percent addition of S-135 hydrocarbon resin into the base PSA, has essentially no tack. The fourth grouping evaluates the 20 percent addition of CN966J75, an aliphatic urethane acrylate oligomer. In this case, the low-dose cure yields similar results as in the base PSA. In the final group, the 20 percent addition of the SR256 (2-ethoxyethoxyethylacrylate) and SR504 (ethoxylated nonyl phenol acrylate) in a 1:1 blend, tack results are improved over the base PSA (only for the 700 mJ/cm2 sample).
Evaluating Shear Adhesion Failure Temperature
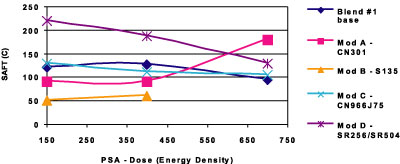
Sartomer chemists next ran SAFT tests using each of the previous blends at each of the cure conditions. The monomer modification has the highest SAFT in the lower-dose PSAs. For blend #1 (Figure 8), the SAFT decreases as the dose increases. Both the base blend and the CN966J75 modification have similar SAFT results. Chemists also found that CN301 only increases SAFT in higher-dose cure levels. Regarding the increase in the hydrocarbon resin, S135, the samples failed early. As in the case of the higher-dose sample modified with the S135, no adhesion was present to run the test.The same series was run for blend #2, the PSA containing aliphatic urethane acrylate. Overall, none of blend #2’s results yielded as high a SAFT as blend #1.
Of the three PSA bases, blend #3 yielded the worst SAFT results. However, this base PSA does not contain an oligomer. The best improvement of the SAFT was seen with CN301, but it was not as good as the other two bases. The addition of the CN966J75 also improved the SAFT, as expected, because it is similar to the base #2 blend. The other three had extremely poor SAFTs.
Key Findings of the Study
These experiments were designed to help formulators determine which additives will help them achieve the specific physical characteristics needed in their UV-curable PSAs. Formulators looking to achieve excellent peel adhesion, increased tack and improved SAFT should review the key findings below and consider modifying their formulations accordingly.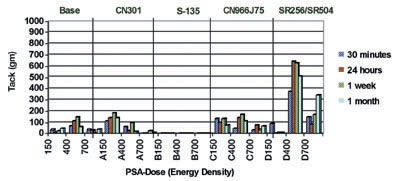
Blend #1 Key Findings
• Viscosity Profile – At room temperature, all the blends have a low viscosity, except the modification with additional hydrocarbon resin.• Peel Adhesion – The higher dose of the “D” blend gives the very best peel adhesion for base #1.
• Tack – The results from Figure 6 show that the best tack for blend #1 was achieved from the monomer dilution, with a dose cure of 400 mJ/cm2.
• SAFT – In Figure 8, it is shown that, again, the best SAFT was achieved with the monomer dilution with a dosage of 150 mJ/cm2 (although the 400 mJ/cm2 also achieved very good results).
Blend #2 Key Findings:
• Viscosity Profile – Room-temperature viscosities for blend #2 were lower than blend #1.• Peel Adhesion – As in blend #1, in blend #2 the modification with additional monomers realized the best peel adhesion results.
• Tack – The modification with additional monomers was able to increase tack more effectively, especially in the monomer-modified PSA.
• SAFT – The best SAFT results for base blend #2 were seen with the addition of CN301.
Blend #3 Key Findings:
• Viscosity Profile – Blend #3 is higher in viscosity than the other blends studied, due to a higher loading of the hydrocarbon resin.• Peel Adhesion – As expected, the addition of CN966J75 improved adhesion over the base itself.
• Tack – As shown in Figure 7, the base PSA shows fairly good tack.
• SAFT – The only formulation that has acceptable SAFT is the modification with the CN301.
Essentially, the CN301 does seem to improve the SAFT, but for the most part has no affect on anything else – except in base blend #3 (which does not contain an oligomer). In base blend #3, CN301 has a negative effect on the tack.
In all cases, the addition of hydrocarbon resin (S-135) yielded negative results for all physical properties. Additional oligomer only had a positive effect in the base blend #3, which did not contain an oligomer.
In short, the most positive impact made by any of the additives was the addition of more monomer to the blend. Besides reducing the viscosity to a printable viscosity (300-900 cps), the monomer improved the peel adhesion and tack with every blend – even improving the SAFT for base blend #1.
References
1. “Low Odor UV Curable Pressure Sensitive Adhesives”, Henry Miller, Radtech ’92, Boston, April 26-30, 1992.2. “Low Cost UV Curable Pressure Sensitive Adhesives”, Craig Glotfelter, Radtech ’94, Orlando Fla., May 1-5, 1994.
3. “Recent Developments in Monomers and Oligomers for UV Adhesives”, Craig Glotfelter, Pressure Sensitive Tape Council, 3rd International Technical Seminar, Orlando, Fla., May 6-8, 1998.
4. “Acrylate Oligomers in Ultraviolet Cure PSA: Glass Transition, Molecular Weight vs. Peel Strength”, Henry Miller, The Journal of The Adhesive and Sealant Council, Fall Convention ’98, Chicago, Oct. 25-28, 1998.
5. “UV Curable Monomers and Oligomers in PSA Applications”, Sartomer Application Bulletin #4027, Exton, Pa.
6. “New Developments in Oligomers for Ultraviolet Curable PSA Applications”, Deborah Sciangola, The Adhesive and Sealant Council, Fall Convention ’99, Pittsburgh, Oct. 24-27, 1999.
For more information
For more information on UV-cure PSAs, contact Sartomer Co., Oaklands Corporate Center, 502 Thomas Jones Way, Exton, PA 19341; phone 610-363-4100 or 800-SARTOMER; or visit http://www.sartomer.com.Looking for a reprint of this article?
From high-res PDFs to custom plaques, order your copy today!


