BYK-GARDNER: Updated Data Analysis Software
The updated software combines color and appearance data while offering new functions to help users with efficient big data management.
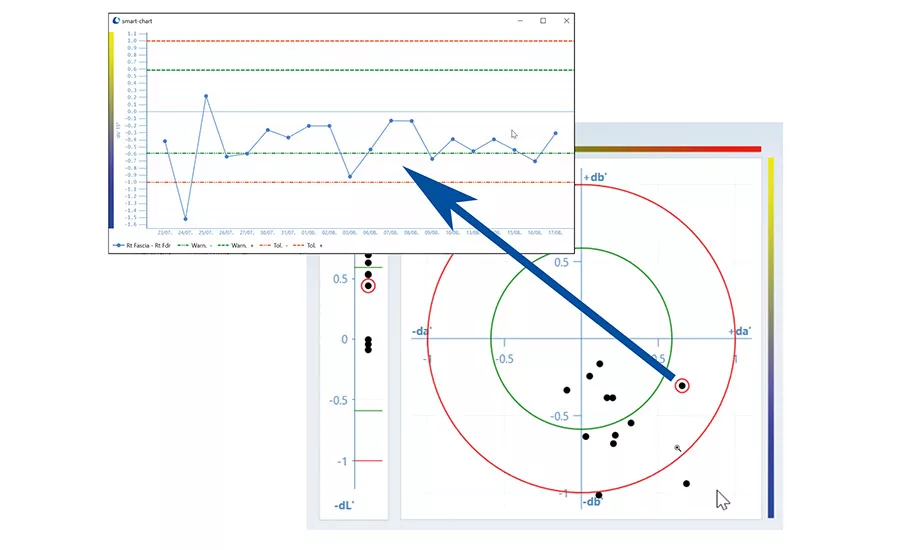
BYK-Gardner recently announced an advanced version of its data analysis software smart-chart, which combines color and appearance data while offering new functions to help users with efficient big data management. The measured data in smart-chart is saved in a SQL database, which allows handling of large data sets over time. According to the company, this reliable database type ensures full network and server compatibility. Data can be easily shared within the supply chain by extracting mini databases that can be sent by email and combined with other databases.
The display of red and green tolerance lines is a new feature. The lines are based on customer product specifications in standard management and can indicate a quality drift so that users are able to proactively take measures to avoid costly rejects. The new drill-in function shows a history trend of the last 20 measurements of the same model, color, and painting line.
A new User Management feature enables the definition of various user levels with different access rights. Complete modules can be deactivated, and deletion and editing of standards and measurement data can be disabled. The user permission can be password protected to make sure everyone has only access to the assigned modules and functions.
To manage lab work, the data can be saved in projects. In addition, for ease of operation, multiple projects can be opened at the same time and an automatic saving and closing process can be defined.
Samples can be organized into different groups (e.g., all samples that are visually Pass-Fail-Borderline can be grouped together). For ease of visualization, each group is displayed in one color in the graphs. An advanced sorting function based on all colorimetric values shown in the data table allows further analysis of measurement results.
For current smart-chart users, the new software version can be downloaded free of charge. Additional details are available at www.byk-instruments.com.
Looking for a reprint of this article?
From high-res PDFs to custom plaques, order your copy today!


