Understanding and Measuring UV LEDs
It is important to consider the variables associated with the LED source and proper measurement tools in order to understand, maintain, and control the adhesive curing process.
UV LEDs with peak spectral outputs of 365, 385, 395, or 405 nanometers (nm) are increasingly being used to cure adhesives formulated to work with LEDs. When compared to broadband mercury sources, UV LEDs offer:
- Solid-state reliability with an output that is expected to be stable over tens of thousands of hours
- Quick on/off capability, enabling them to be “cycled on” when curing needs to take place and “cycled off” between parts
- Less thermal transfer, which can be beneficial or detrimental depending on the process and materials
- More narrow spectral output
The impact of spectral differences should be evaluated based on the adhesive, photoinitiator package, and desired cure properties. The longer UV wavelengths typically found in LEDs have the ability to penetrate but are missing the shorter UVC wavelengths normally associated with surface cure. In adhesive applications, the lack of the shorter UVC wavelengths may not be an issue compared to the other UV applications that are dependent on the surface cure properties that UVC provides (see Figure 1).
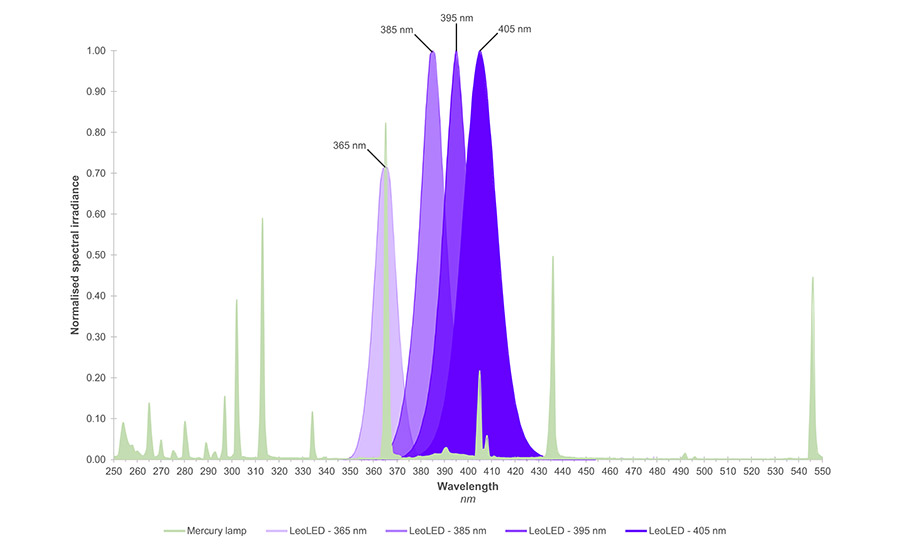 Figure 1. The spectral distribution of a mercury source compared to 365, 385, 395, and 405 nm LEDs. The energy from the mercury source is “broad” compared to the concentrated energy from each individual LED. (Courtesy of GEW (EC) Limited.)
Most LED source manufacturers identify and specify their peak center wavelength (CWL) with a tolerance of ± 5 nm to allow for variations in how the individual diodes in the LED are screened and selected (binned). The peak output for a 395-nm LED is expected to fall between 390-400 nm. At the 50% power level, the spectral output may spread to out to a distribution of 15-20 nm. At the 10% power level, the spectral distribution may spread out to 30+ nm (see Figure 2).
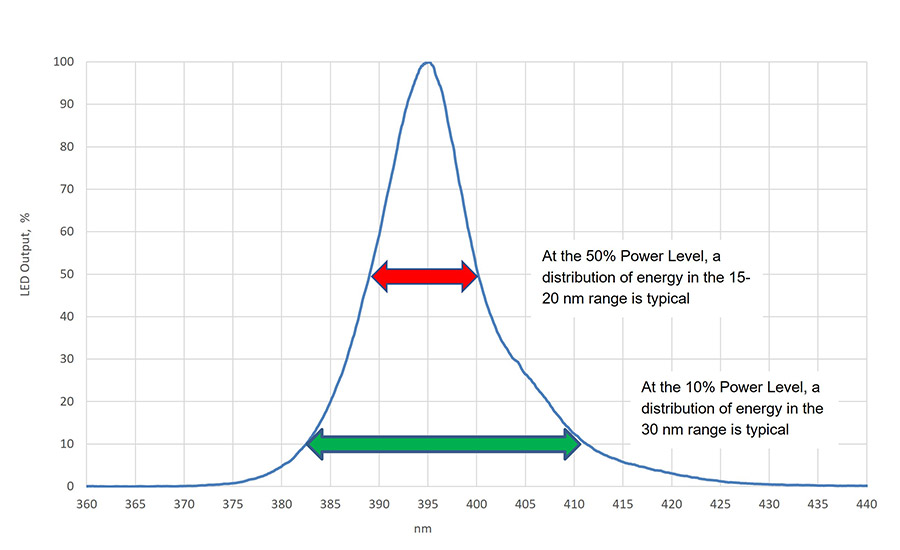 Figure 2. The typical distribution from a 395-nm LED with CWL right at 395 nm. To accurately report the energy, the radiometer needs to be able to capture the energy shown and account for the ± 5 nm tolerance in the CWL of the LED.
Measurement Overview
Irradiance (i.e., intensity) is the power of the UV LED source arriving at the cure surface. Irradiance is important for proper adhesion, penetration, and depth of cure of the adhesive. Irradiance is measured in watts/cm2, and LED manufacturers typically specify their UV LED output based on the value at the array’s optical window or “glass.”
It is important to understand how the irradiance changes based on power settings, distance, and cleanliness of the optics window. A radiometer can help determine how the UV LED performs at different heights above the substrate. A radiometer with a flat response in the expected CWL ± 5 nm tolerance, along with a wide enough response to capture all LED energy, will provide accurate values (see Figure 3).
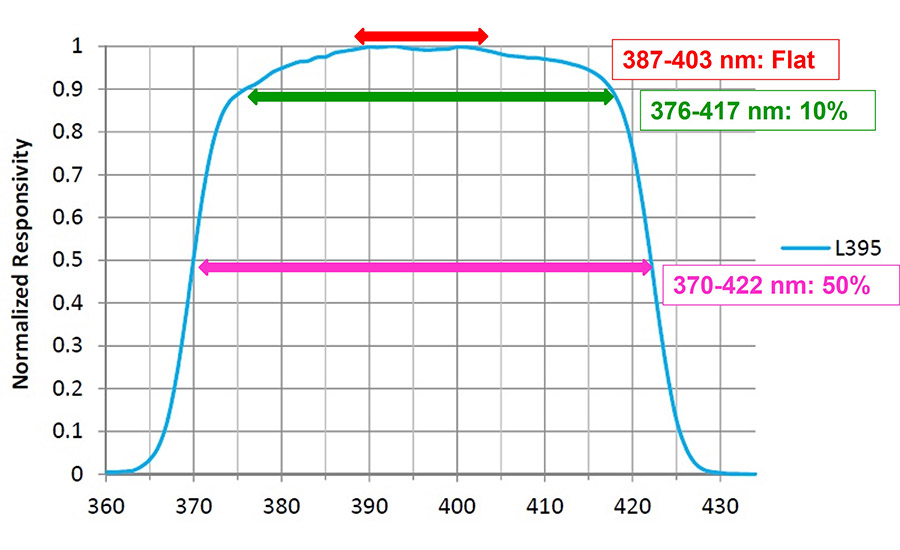 Figure 3. Example of band response that incorporates all optics in the stack in a patented response. The response is flat to capture the variation associated with a ± 5 nm variation in the CWL and wide enough to capture the expected distribution of energy.
Sometimes called “dose,” energy density is a second factor critical to proper curing. Energy density is measured in joules/cm2 and incorporates time (1 watt for 1 second = 1 joule). The energy density is important for the complete cure of the adhesive.
To cure adhesives, both the irradiance and exposure time must be within the established process window. Like a recipe that requires a certain oven temperature and cooking time for best results, UV curing recipes usually require minimum irradiance and exposure time (energy density) values.
The output power or irradiance (W/cm2) of UV LED sources has increased tremendously, with available commercial LEDs that deliver 25+ W/cm2. Irradiance levels today are seldom an issue compared to the first LEDs. Using an LED in a power class slightly above what is required can enable the LED to be run at a slightly lower power level (i.e., 75% vs. 100%), potentially increasing its useful life. It is critical to make sure that the LED selected delivers the needed energy density (J/cm2) for the process or application based on specific requirements for the exposure/cycle time or line speed.
Changing Light Sources
Significant differences in UV output occur between a mercury and LED source. Converting a process from mercury to LED involves more than “turning on” an LED and “turning off” a mercury source. The adhesive formulation, cure properties, and process parameters need to be evaluated, adjusted, documented, and matched to an LED in both power and spectral output.
Swapping between two different brands of LEDs can also be risky without testing and qualification, particularly if the process window is tight. The distribution of energy can vary greatly from brand to brand. In addition, differences between two different LEDs can be spectral. Assuming the ± 5 nm binning tolerance is correct, one 395-nm source could have a CWL of 390 nm, while the other is at 400 nm. Could this make a difference? Maybe, but probably not.
Not all manufacturers bin to the ± 5 nm level, and the CWL may be further outside of what is expected or specified. In one example, 395-nm LEDs were observed far outside of the spec, binned to ± 5 nm tolerance with CWL values of 410-415 nm.
Irradiance values must also be taken into consideration when undertaking a source switch. Clarify the stated irradiance (W/cm2) value and whether it is theoretical (calculated) or actual (measured). If measured, clarify the measurement point and instrument used. The power delivered to the substrate is normally less than the power measured at the quartz LED window.
The energy density (J/cm2) value delivered from two different LED sources can vary widely based on the array design and the size/number of diodes. The number of joules delivered between two different LED sources is a key difference that needs to be understood. Be careful if the LED manufacturer only talks about their watts instead of discussing both watts and joules.
Additional considerations include optics and heat. For example, do either of the two LEDs have optics that change the way the energy is distributed to the cure surface? An LED array’s heat management can impact the cure, along with the lifetime and stability of the LED. How is the unit cooled (e.g., air or water)?
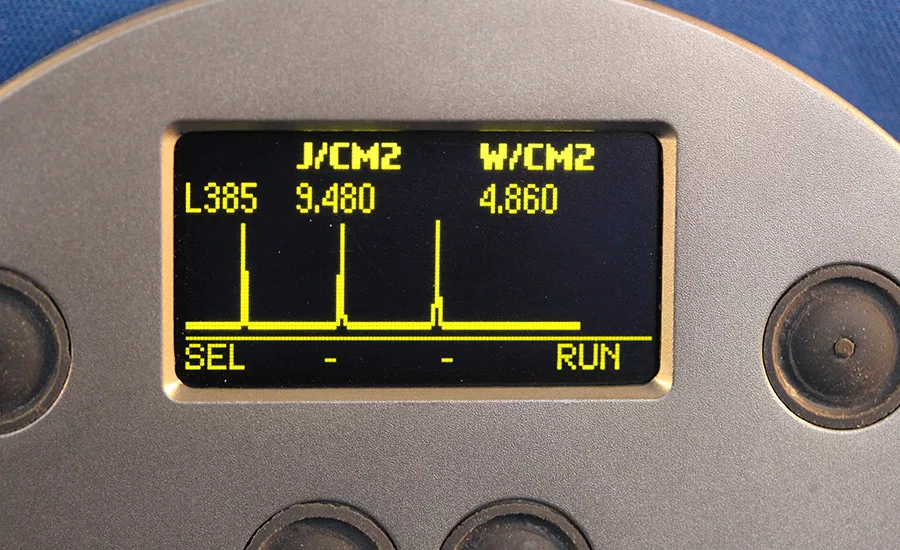
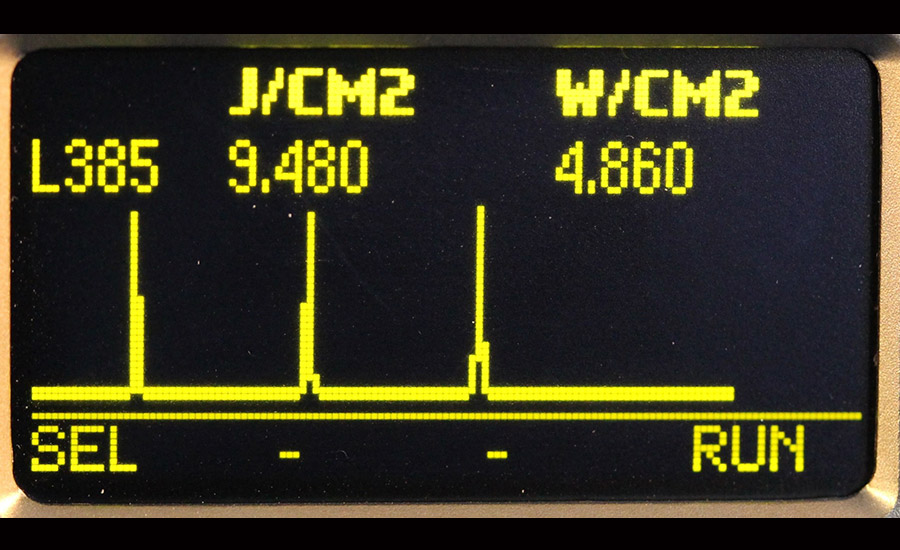 Figure 4. Radiometer display showing the energy density (9.480 J/cm2) and irradiance (4.860 W/cm2) values. Based on the three peaks shown, the radiometer was passed under three LEDs. The energy density values are the sum of all three passes, while the irradiance value is the peak value from the most intense LED. In this measurement run, the three LEDs had similar irradiance values.
Why Measure?
If UV LEDs are stable over tens of thousands of hours, why is measurement important? From a high-level perspective, measuring UV LEDs allows users to save time and money by establishing, maintaining, and operating in a defined process window; reducing scrap and increasing product yield; confidently transitioning the process from the lab to production; and providing a certificate of conformance if required by the end user.
In terms of production, measuring UV LEDs enables users to uncover operator errors and process parameter changes. Adjustments to applied power, speed/exposure time, and/or LED height can impact the process. Measurement also helps drive targeted maintenance programs and identifies when the LED output has changed and/or the quartz window has become contaminated.
If the process is not working or has suddenly changed, measurement helps facilitate troubleshooting. This includes the premature failure of a component (e.g., power supply, cable, LED array) in the system.
Adhesive suppliers and formulators can provide cure targets, which serve as starting points and can vary widely. The target values require additional work to allow users to establish and document a process window for their application prior to starting production.
Radiometer Selection and Use
Many factors should be considered when it comes to selecting a radiometer. In addition to the size of the instrument and the available space, it is important to verify that the instrument responsivity is optimized for the LED. Radiometers designed for broadband mercury sources have responses and dynamic ranges matched to the output and the irradiance levels of a mercury-based source. Instrument manufacturers can help determine if the instrument response is matched to the type of LED source being measured.
There are two approaches to radiometer responses, with the instrument manufacturer determining the width and shape of each band response. To obtain accurate LED readings, it is important to use a radiometer with a response as flat as possible over the ± 5 nm CWL range of interest. Optically, it is easier to achieve a flat response over narrower bands. Instruments perform best when the source used for calibration is the same as the source that the instrument will measure.
A wide-band radiometer has a response approximately 100-200 nm wide. Instruments with wide-band responses have been used for years with mercury-based sources. In most cases, a wide band allows the user to have one instrument. With a wide-band instrument, there is one irradiance value and one energy density value. This makes it easy to use and understand.
The shape and overall flatness of the optic response over the 100-200 nm range is not as easy to control with a wide-band approach. A wide-band response will normally pick a source type and a point somewhere along the 100-200 nm instrument band for the calibration point. The values measured are normally most accurate at that point.
A narrow-band radiometer has a response approximately 10-70 nm wide. Instruments with narrow-band responses have also been used for years with mercury-based sources. With a mercury-based source, a radiometer with multiple narrow bands allows the user to independently monitor the shorter UVC energy responsible for surface cure and the longer UVA or UVV responsible for through cure and adhesion. The shape and flatness of a narrow-band response can usually be controlled better.
If LEDs with different spectral outputs are used, a narrow band approach requires the user to either have an instrument for each LED band or a multiband LED instrument. Narrow-band instruments will use a calibration source that closely matches each type of source being measured. This and the flatness of the response can lead to better instrument performance.
It is important to verify that the instrument dynamic range is optimized for the LED. After all, using a truck scale to weigh an infant does not provide accurate results. The same is true of using an instrument optimized for low-power sources to measure a high-power LED source. The readings can exceed the range of the instrument and “peg it” so that each reading looks consistent.
The width (not length) of a typical LED (1 in./25.4 mm) is smaller than the width of a typical mercury system (6 in./152.4 mm). In a moving application, the time the substrate spends under the UV is normally less with an LED than a mercury system. The same is true of the radiometer. Verify that the sample rate of the radiometer will allow the collection of an adequate number of samples under the LED at the speed the data is collected. For non-moving, long-duration static exposures, the sample rate is not as much of a concern as the instrument temperature.
 Figure 5. With some instruments, it is possible to “see” the differences between different LEDs or different cure conditions/parameters. Measurement of these two different LEDs shows the blue data were collected at a much slower line speed than the red data. The irradiance and energy density values for the “blue” trace (270 mW/cm2 and 3,892 mJ/cm2, respectively) were also much higher than the values measured for the “red” trace (85 mW/cm2 and 2,642 mJ/cm2).
While LEDs produce less thermal transfer than mercury-based systems, they are not heat free. On static LED exposures, monitor the temperature of the radiometer so that it does not exceed the recommended temperature limits. Let the unit cool between readings. A good rule of thumb: If the radiometer is too hot to touch, the unit was too hot to measure.
LEDs have thousands of individual point sources. Positioning the instrument optics at different positions under the LED can lead to slight differences in the readings, especially if they are extremely close to the quartz window of the LED. For consistent results, collect the data in a consistent manner.
Finally, users should follow the manufacturer’s guidelines on how to use, care for, and clean the instrument. Keep in mind that radiometers need periodic calibration and service.
Controlled Results
UV LEDs work well to cure adhesives in many types of applications. For the best results, be sure to consider the variables associated with the LED source and the proper measurement tools to use in order to understand, maintain, and control the process.
For more information, contact the author at (703) 925-1830 or jraymont@eit.com, or visit www.eit.com.
Note: Images are courtesy of EIT LLC, unless otherwise indicated.
Looking for a reprint of this article?
From high-res PDFs to custom plaques, order your copy today!


