Tailoring PSA-Dispersion Rheology for High-Speed Coating

High shear viscosity of PSA dispersions has to be controlled carefully to achieve excellent coating properties at ever-increasing coating speeds needed to realize cost-effective production of adhesive tapes, labels or foils. Capillary viscometry is necessary for an accurate characterization of high shear rheology. Particle size distribution is the key to rheology control. A "near-Newtonian" flow profile can be achieved over a wide shear rate range (10-1 to 106 s-1) even at solids contents beyond 60% with a properly designed particle size distribution in the range from 150 to 800 nm.
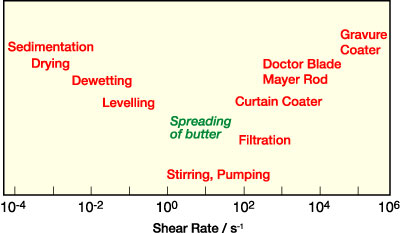
Successful aqueous PSA dispersions combine outstanding adhesive properties such as tack, peel strength and shear resistance with excellent defect-free coating properties. Cost-effective production of adhesive tapes, labels or foils demands ever-increasing machine speeds. A careful control of dispersion rheology in a wide shear rate range is mandatory for good runnability and coating quality. Typical shear rates relevant for different aspects of the coating process1 are shown in Figure 1. A well-balanced viscosity level at shear rates below 1 s-1 is necessary to provide excellent leveling and minimize dewetting simultaneously. The viscosity at intermediate shear rates between 10 and 103 s-1 determines not only the stirability and pumpability, but also the transfer to the roll or cylinder. The highest shear rates occur at the coating head. On a curtain coater, typical shear rates are between 102 and 104 s-1. In gravure coating systems, shear rates of more than 105 s-1 are reached. The fastest coating line at BASF's coating center in Ludwigshafen, Germany, runs at speeds of up to 1,500 m/min, corresponding to shear rates up to 106 s-1.
The challenge is always to minimize the high shear viscosity while maintaining the highest possible solids content to reduce drying time and energy consumption, i.e., cost.
Well-established rotational rheometry techniques cover the regime of low and intermediate shear rates but do not provide information about shear rates beyond 103 s-1, and in general, extrapolation of rotational rheometry data to the high shear regime fails. Thus, capillary viscometry has to be used to determine the rheological behavior of PSA dispersions in the high shear regime.
This article addresses the basics of this technique and appropriate data treatment to extract reliable information from the raw data especially at very high shear rates and their applicability to typical PSA dispersions. In addition, we discuss how to tailor the rheological behavior of PSA dispersions in the whole shear rate range relevant for the coating process. This strategy is based on a careful choice of the size distribution of the dispersed polymer particles. The phenomenon of shear thickening, which occurs in almost all dispersions at high enough particle loading and shear rates, will be especially addressed.
of PSA Dispersions
Experimental
Samples
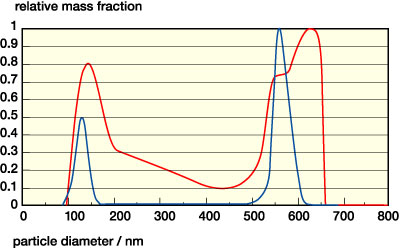
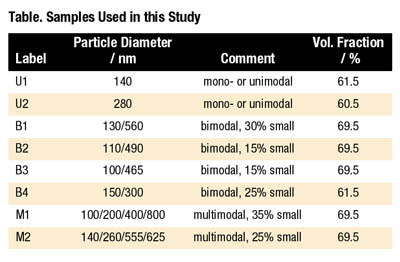
A series of model PSA dispersions widely differing in their particle size distribution has served as the basis for the investigations presented here. The dispersions have been obtained from standard emulsion polymerization. The chemical composition of the polymer particles is always straight acrylic with a Tg of -40 degrees C and a particle density of Ppart = 1010 kg/m3. Particle size distributions have been obtained using analytical ultracentrifugation.2 Results are summarized in the table and in Figure 2.
(from AUC )
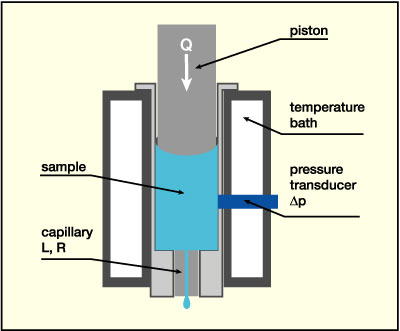
Viscosity measurements in the shear rate range from 10-2 up to 103 s-1 were done with a controlled stress rotational rheometer (Physica MCR 300, from Physica Messtechnik GmbH, Germany) equipped with a concentric cylinder sample cell (gap width 1.15 mm). Viscosity data in the shear rate range from 103 up to 2.106 s-1 have been obtained using a commercial piston driven capillary viscometer (Rosand RH 2000, from Bohlin Instruments GmbH, Germany) equipped with a 300 bar pressure transducer and homemade stainless steel capillaries of different lengths and radii. A schematic drawing is given in Figure 3a.
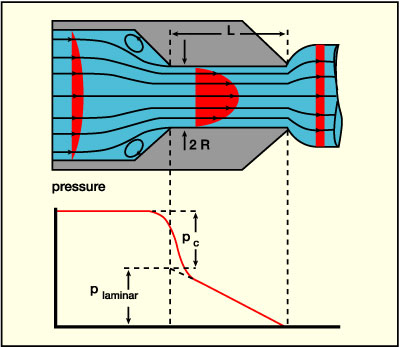
The basic principles and a detailed discussion of the data treatment in capillary rheometry have been documented.3 The Appendix summarizes the basic ideas and equations, with special focus on an accurate determination of the entrance flow effects (see Figure 3b), especially relevant at very high shear rates beyond 105 s-1.
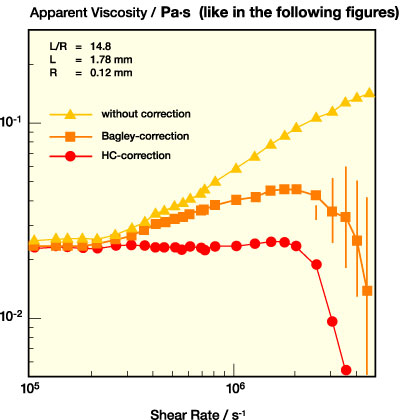
The relevance of a careful correction of the entrance effects in capillary rheometry is demonstrated here for a typical aqueous PSA dispersion. In Figure 4, apparent viscosity data calculated from the measured pressure without any corrections are compared to the respective data with the full Bagley correction. Measurements with three capillaries of different L/R are necessary for this procedure, and those corrected according to Hagenbach-Couette. Figure 4a shows the data for a short capillary (L/R = 14.8), Figure 4b those for a long capillary (L/R = 93.3).
For the short capillary, the uncorrected viscosity increases strongly with increasing shear rate and is much larger than the true Bagley corrected data, thus indicating that the recorded pressure is strongly dominated by the entrance pressure losses. The Bagley correction gives reliable viscosity data up to shear rates of about 2.106 s-1; going beyond this limit does not make much sense, since the error in Plaminar that determines n is as large as the difference between the two almost equal, large quantities Pmeasured and Pc.
For the long capillary with L/R = 93.3, the contribution of Pc is small, and even for the highest shear rates it is not more than about a 10% correction. Therefore, in many cases this correction may be disregarded and the viscosity can be determined from a single measurement. This is especially true if the viscosity of the dispersion is higher than for the example chosen here. The maximum accessible shear rate for the long capillary is usually set by the upper limit of the pressure transducer, i.e., by the sample viscosity, and for typical PSA dispersions it is around 106 s-1.
Striving for even higher shear rates may also be limited by the onset of turbulent flow.
Finally, it should be noted that for both capillaries the HC-correction overestimates Pc as expected for such shear-thinning fluids and is not at all appropriate for a correct viscosity determination.
Controlling Viscosity by Particle Size and Particle Loading
Monomodal DispersionsRheological properties of dispersions or suspensions are strongly coupled to the volume occupied by the particles. The particle volume fraction j is related to the solids content s.c. as well as to the density of the particles and the continuous phase, Ppart and Pcont, respectively (see Equation 1).
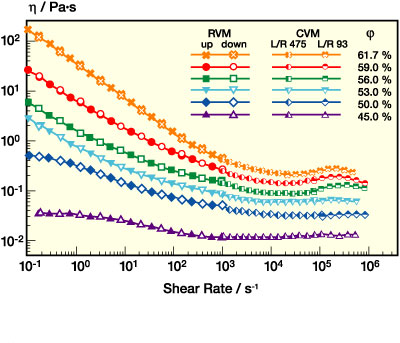
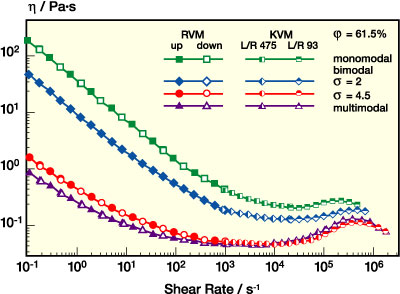
Viscosity curves for a monomodal dispersion with 280 nm particle diameter are shown in Figure 5a. Volume fraction j was increased from 45% up to 61.5%, which is close to the maximum packing fraction of 63% (for random close packing) at which the low shear viscosity of such suspensions goes to infinity.4 As expected, viscosity increases remarkably with increasing particle loading. But for all j investigated here, a pronounced shear thinning is observed in the range from low to intermediate shear rates. At concentrations below 53%, the viscosity decay starts from a constant viscosity value, the so-called zero-shear viscosity h0 (usually reached at shear rates below 1 s-1). At higher concentrations, the degree of shear thinning is even more pronounced and h decays monotonically in a wide shear rate range. For the highest particle concentration j=61.5%, the viscosity drops by three orders of magnitude when increasing the shear rate from 10-1 s-1 to 104 s-1. At high shear rates, h seems to run into a plateau value usually called h•, but at volume fractions above 53% it increases again as the shear rate is further raised. This behavior is termed shear thickening. The viscosity then goes through a maximum hm at a critical shear rate and finally decays again until the limits of capillary rheometry are reached, where an accurate viscosity determination is disturbed by secondary flow phenomena like flow instabilities and turbulence (see Appendix). The critical shear rate •gm is shifted to higher values as j decreases until the viscosity maximum vanishes around j = 53%. This is similar to what has been observed for many other shear thickening suspensions according to a review of Barnes.5
Figure 5b compares the viscosity curve of the dispersion discussed in the previous section with another monomodal dispersion with about half the particle diameter but the same particle loading. Obviously, the low shear viscosity is much higher for the small particle suspension. This is due to the reduced mean particle separation, which gives rise to stronger repulsive interactions among the particles resisting the applied shear force. The high shear limiting value h• is independent of particle size, since it is dominated by hydrodynamic interactions. Shear thickening is not observed for the small particles. Its onset is probably shifted to shear rates outside our experimental window. This will be discussed in more detail.
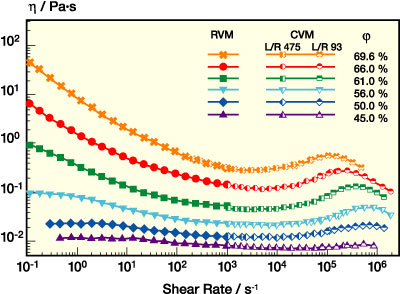
It is well known that the viscosity of suspensions can be drastically reduced by mixing particles of different sizes.6-7 The reason is that a mixture of two particle species can be packed much more effectively than any monomodal suspension because the voids between the large particles are filled with small ones. The following section will discuss this topic in more detail. First, we demonstrate the effect of particle loading on the viscosity for a bimodal system with dsmall = 130 nm, dlarge = 560 nm and a small particle volume fraction of 30% (see Figure 6). The shape of the viscosity curves is very similar to those of the monomodal system, but the absolute values are much lower if compared at constant j. Low shear viscosity is again much more reduced than the high shear viscosity, and the shear thickening is shifted to higher shear rates upon dilution until it is totally suppressed for j below 53%. The viscosity maximum in the shear thickening region is more pronounced here than for the monomodal system. The reason is the strong dependence of the shear thickening phenomenon on particle size, which will be discussed in more detail.
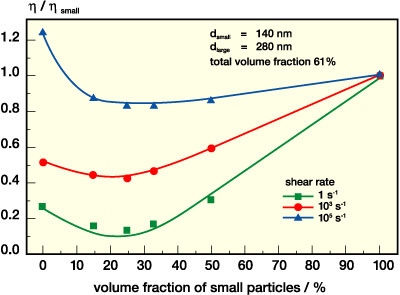
The mixing ratio has a strong effect on the viscosity. This is demonstrated for a series of mixtures of the above-mentioned monomodal dispersions. In Figure 7, we compare the viscosity of the mixtures at different shear rates as a function of the small particle volume fraction. For better comparison the data are normalized by the respective viscosity value for the small particle suspension. At low shear rates (here •g=1 s-1) the viscosity drops drastically and reaches a broad minimum when about 20-30 vol% of small particles are added to a suspension of large ones. The viscosity of these mixtures is only half that of the large particle suspension and is about one decade lower than that of the small particle system. These findings are in good quantitative accordance with data reported in the literature for a large number of very different colloidal and non-colloidal suspensions.6-10 The effect diminishes as the particle loading decreases and is hardly observable for j < 50%. Similar results are found at •g= 103 s-1, but the viscosity minimum is much shallower here. Finally, at •g= 105 s-1 the viscosity is almost the same for all mixtures and it is only about 10-15% below that of the monomodal small particle dispersion. At this shear rate the large particle suspension has the highest viscosity due to the shear thickening effect.

Besides the mixing ratio, the size ratio s = dlarge/dsmall is essential for the viscosity of bimodal dispersions. For suspensions of large glass beads, it has been reported that the viscosity reduction increases with increasing size ratio.7 In a recent study on aqueous polymer dispersions it was demonstrated that this is not strictly valid for colloidal suspensions.8 The reason is that the colloidal repulsive forces among the particles are getting more and more important as the particle size decreases. Correspondingly, for a given mass fraction, the effective volume fraction - which takes into account the excluded volume around each particle which is not accessible by the others due to the repulsive interaction - increases as the particle size decreases, and, in turn, the viscosity of the mixture also increases. These colloidal interactions contribute significantly to the viscosity at diameters below 150-200 nm for typical commercial dispersions. On the other hand, from a technical point of view, a particle diameter of 700-800 nm is the upper size limit at which aqueous polymer dispersions can be polymerized with a reasonable time-space yield. Thus, the optimum size ratio for a low-viscosity dispersion is about 4.5. This is documented in Figure 8, where the viscosity curves of two bimodal dispersions with total volume fraction of 61% and a small particle fraction of about 30% but with different size ratio s = 4.5 and s = 2 are compared. At low to intermediate shear rates, the dispersion with a larger s has a much lower viscosity, whereas in the high shear (and especially the shear thickening region) the viscosity curves approach each other. At a shear rate of 1 s-1 the viscosity is about an order of magnitude lower for the dispersion with ratio s = 4.5, while the viscosity ratio reduces to a factor of 2 at 500.000 s-1.
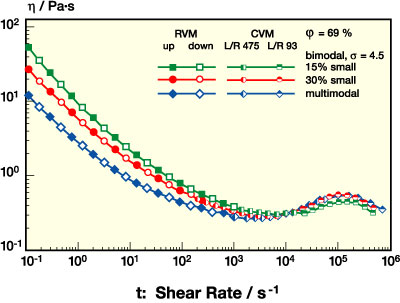
PSA dispersion rheology can be further optimized by broadening the particle size distribution, e.g., by introducing additional particle species. This is clear from the data presented in Figures 8-9. In Figure 8, viscosity curves for mono-, bi-, and multimodal dispersions with j = 61% are compared. Figure 9 shows data for two bimodal dispersions with similar size ratio but different small particle fraction and a multimodal system now at j = 69%. Both data sets show that the additional particle species further lower the low shear viscosity, thus providing additional benefits, e.g., for the handling of the dispersions, while beyond 103 s-1 h is almost unaffected. In conclusion, the rheology profile of a PSA dispersion can be tailored toward a "near-Newtonian" flow behavior by broadening the size distribution at a high level of solids content or particle volume fraction without additional thickener.
The phenomenon of shear thickening is related to the formation of clusters of particles moving collectively along the streamlines. These so-called hydroclusters form when hydrodynamic forces are strong enough and act long enough to bring the particles into close contact. They immobilize part of the aqueous phase and thus increase the viscosity. This phenomenon is reversible since the particles are still separated by a thin lubrication layer of solvent, and the clusters decay as soon as the flow field ceases.11 The onset of shear thickening shifts to higher shear rates when the particle size decreases. Barnes5 has reported that the corresponding critical shear rate scales as 1/d2. This phenomenological finding is based on the evaluation of a large set of data including suspension of very different types of particles suspended in different media and covering a broad size range from 0.01 to 100 µm. In a more recent study on a homologous series of colloidal so-called hard sphere silica suspensions covering the size range from 0.1 to 1 µm, it was found that the phenomenon is controlled by a critical shear stress tc ~ 1/d2 and not by shear rate.12 Here we have investigated how the location •gm of the viscosity maximum in the shear thickening region is related to the mean particle size and in Figure 10 •gm is plotted vs. the volume averaged mean particle diameter dm for a set of 15 bi- and multidispersions including those listed in Table 1. Obviously, •gm scales proportional to 1/d2. This seems to agree well with Barnes' results, although we have to keep in mind that the diameter range for the data set investigated here is relatively small.* In conclusion, shear thickening can be avoided or at least shifted to shear rates beyond the range that is relevant for technical coating processes by lowering the average particle size. Another approach to suppress shear thickening would be to increase the repulsive forces among the particles as proposed by Maranzano and Wagner.12 In both cases, the price to pay is a strong increase in the viscosity at low and intermediate shear rates, and this is probably not appropriate for commercial PSA dispersions which have to exhibit a well-balanced viscosity profile over a range of shear rates.
* In contrast to the findings reported in other sources12, the corresponding shear stress tm = hm· •gm does not vary very much here.
Conclusion
The rheological properties of aqueous PSA dispersions have to be well-balanced over a wide shear rate range in order to meet the requirements of modern coating processes. Low shear viscosity can be characterized by rotational rheometry, whereas viscosty data at shear rates beyond 103 s-1 can only be obtained by capillary viscometry. At shear rates even higher than 105 s-1, a careful treatment of secondary flow effects like entrance pressure losses is mandatory.At least a bimodal particle size distribution is necessary to achieve a low viscosity level at high particle loading beyond 55 vol%. The optimum size ratio of large-to-small particles is between 4 to 5, and the fraction of small particles should be around 25 vol%. The low shear viscosity can be further reduced by introducing additional particle species, which leave the high-shear viscosity almost unaffected. Shear thickening is always present at high enough shear rates and particle volume fractions. The shear rate range in which it occurs strongly depends on particle size and can be shifted to higher shear rates by decreasing the average particle diameter.
PSA dispersions with a broad particle size distribution in the range from 150 to 800 nm thus can provide a "near-Newtonian" flow profile at a high solids content without the addition of thickener.
Acknowledgements
Stimulating discussions with H. Diehl and A. Dragon and their valuable suggestions are gratefully acknowledged. We thank G. Langhauser for the synthesis of the PSA dispersions; D. Lingenfelder and J. Steidel are thanked for carefully performing the rheological measurements. M. Kaiser is thanked for the AUC measurements.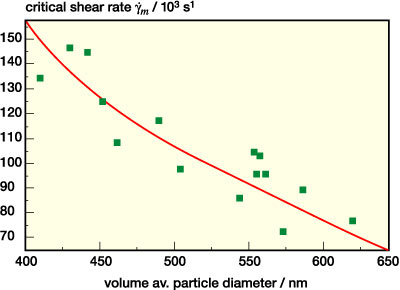
References
1 B. Ludrock, Adhesive Technology 12,16-17 (2000).2 W. Machtle in S.E. Harding , A.J. Rowe, and J.C. Horton (Eds.) AUC in Biochemistry and Polymer Science, Royal Society of Chemistry, Cambridge (UK), 1992.
3 C. Macosko, Rheology-Principles, Measurements and Applications, VCH Publishers Inc., New York, 1994.
3a N. Willenbacher, H. Hanciogullari, H.G. Wagner, Chem. Eng. Technol. 20, 557-563 (1997).
4 I.M. Krieger and T. Dougherty, Trans. Soc. Rheol. 3, 137 (1959).
5 H.A. Barnes, J. Rheol. 33(2), 329-366 (1989).
6 R.J. Farris, Trans. Soc. Rheol. 12, 281-301 (1968).
7 J.S. Chong, E.B. Christiansen, A.D. Baer, J. Appl. Polym. Sci. 15, 2007-2021 (1971).
8 B. Dames, B.R. Morrisson, N. Willenbacher, Rheol. Acta, 40, 434-440 (2001).
9 B.E. Rodriguez and E. Kaler, Langmuir 8, 2382-2389 (1992).
10 P. D'Haene and J. Mewis, Rheol Acta 33, 165-174 (1994).
11 J. Bender and N.J. Wagner, J. Rheol. 40(5), 899-915 (1996).
12 B.J. Maranzano and N.J. Wagner, J. Chem. Phys., 114(23), 10514-10526 (2001).
Basic Equations of Capillary Rheometry
The volumetric flow rate Q through the capillary is controlled by the velocity of the piston and is related to the apparent shear rate according to= (2)
The shear stress t at the capillary wall is related to the pressure drop inside the capillary plaminar = pmeasured - pc by
t = (3)
where pc accounts for additional pressure losses at the entrance of the capillary, which have to be subtracted from the total pressure given by the transducer1 in order to get the true shear stress driving the viscous flow in the capillary.
The apparent viscosity ha is then defined as
ha = (4)
and finally, the true viscosity h () is obtained by a simple re-scaling of the shear rate:
h ( ) =() for = 0.83 (5)
This approximation does not differ significantly from the mathematically exact Rabinowitsch-Weissenberg correction [3].
Especially at shear rates beyond 105 s-1, an accurate correction of the entrance pressure losses is mandatory to get the true dispersion viscosity. For the low viscosity fluids considered here, viscous contributions to the entrance flow can be neglected [3a]. Then pc is mainly determined by three effects:
· acceleration of the fluid from about zero velocity in the reservoir to the mean velocity in the capillary
· contraction of stream lines at the entrance of the capillary
· deformation of the flow field from a plug flow within the reservoir to a parabolic flow profile within the capillary
For Newtonian fluids pc is approximately given by [3, 3a]
pc = (6)
which is called Hagenbach-Couette (HC) correction or kinetic energy correction.
For purely viscous, but shear thinning fluids pc is overestimated by Eq. (6), since the deformation of the flow profile in the capillary is less pronounced as for Newtonian fluids.
In the case of viscoelastic fluids like polymer melts or concentrated solutions an increased resistance to the converging flow at the capillary entrance can give rise to an additional contribution to pc, which is significantly larger than the HC-term. For stable, concentrated, aqueous suspensions or formulations like PSA dispersions there is little evidence for a significant viscoelastic contribution to pc at high shear rates, even if these systems exhibit viscoelastic behavior under low shear conditions (e.g. small strain oscillatory shear).
Experimentally, pc can be determined from measurements with capillaries of different L/R but similar radius. For constant the resulting extrusion pressure pmeasured is plotted versus L/R (Bagley plot) and pc is obtained from a linear extrapolation of corresponding data points to L = 0 (intercept with the p-axis). This procedure is called Bagley-correction [3].
Another limiting factor in capillary rheometry is the onset of turbulence. According to the classical Reynolds criterion [3] turbulence develops if the dimensionless quantity Re = exceeds at value of 2100. Thus, defining an upper limit for a reasonable viscosity measurement depends on the capillary radius R and the fluid viscosity h. For the a fluid with density r =1000 kg/m3 and h =10-2 Pa¿s, the critical shear rate would be 1.5¿106 s-1 in a capillary with R = 0.17 mm (as used in most experiments presented here).
1 In our set-up the transducer is mounted about 20 mm above the entrance of the capillary
Looking for a reprint of this article?
From high-res PDFs to custom plaques, order your copy today!


