Embedding Digitalization into Polyurethane Applications
To reduce the development time of its formulations, this major chemical company has worked to embed digitalization into each aspect of product development.

shivkantsharma07 / Creatas Video+ / Getty Images Plus via Getty Images.
In today's global market, conditions are constantly changing due to technological advances, demands for differentiated performance, and changing societal needs. Companies must innovate at an unprecedented speed by utilizing existing data and developing a new generation of mathematical models and machine learning techniques. While digitalization is an increasing factor and a key innovation driver in many industries, its use in the polyurethane industry (PU) is challenging due to the wide range of polyurethane chemistries, processing conditions, and applications.
A typical PU formulation may contain 10 or more ingredients. A complex series of chemical reactions occurs when these components are mixed; as the reactions proceed, the viscosity increases due to increased molecular weight and urethane/urea linkages formation.
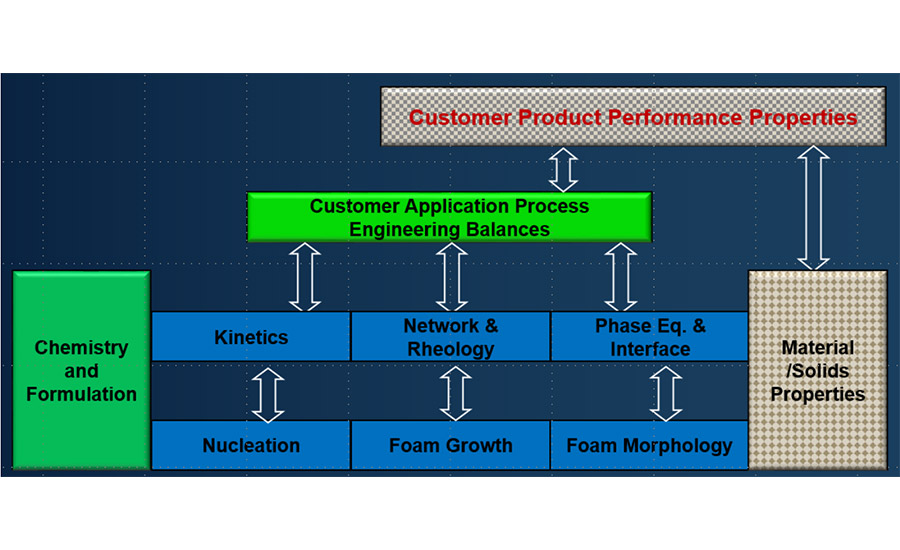
When the concentration of urethane/urea linkages, often referred to as Hard Segments (HS), exceeds the solubility limit, they phase separate from the polyol-rich phase referred to as Soft Segments (SS). In foam applications, gas bubbles nucleate and then grow when the concentration of gases generated by the evaporation of blowing agents and those generated by chemical reactions exceeds the solubility limit. To achieve the desired foam properties, bubble growth rates and increase in viscosity must be carefully balanced. A schematic of various interactions is shown in Figure 1.
*Click the image for greater detail
Figure 1 - Schematic showing interaction between various physical and chemical phenomena in polyurethane applications. The green color signifies the starting points, and the checked boxes signify the end points
A formulator begins selecting the ingredients, enabling the chemical reactions under typical laboratory conditions, and measuring the material properties. However, the time-temperature history in the application process at the customer site may differ from the laboratory process conditions. Therefore, reactions may not go to completion in the customer process even when the reactions reach the completion point during laboratory testing. To reduce reproducibility issues, the researcher needs to consider and quantify the effect of the variables in Figure 1 on product performance. Several efforts have been made to use math modeling for various process strands shown in Figure 11-3.
Chemical companies are also exploring Artificial Intelligence (AI) to discover hidden trends4, 5. However, the use of AI in the product development of polyurethanes is limited.
To reduce the development time of its formulations, Dow Inc. has embarked on a transformation journey in which digitalization is being embedded into each aspect of product development. While this journey is by no means complete, Dow has made notable progress. A team of subject matter experts on polyurethane chemistry, material science, fluid mechanics, reaction engineering, machine learning, and information sciences have been working together to develop a new work process which Dow refer to as "Predictive Intelligence" (PI). In this paper, the authors give a brief introduction to PI and present some recent case studies.
Predictive Intelligence–The Work Process
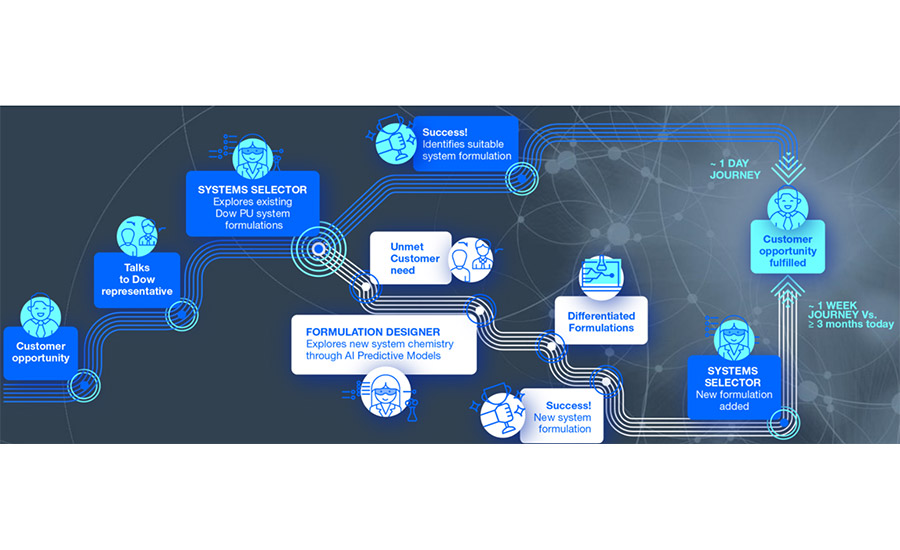
Predictive Intelligence (PI) is a digital capability for product innovation, process simulation, and troubleshooting. It offers real-time access to historical data and material science analysis. PI predicts properties using physics-based math models and machine learning techniques. It covers most major market segments of polyurethane applications. A schematic of the PI work process is shown in Figure 2. In the following discussion, formulations and products are used synonymously.
*Click the image for greater detail
Figure 2 - Predictive intelligence work process.
The process begins with a customer reaching Dow to work on a development opportunity. The company’s commercial and R&D teams use the systems selector to search for existing local and global products and formulations that can match customer's key performance indicators (KPIs). When a suitable system is identified, the customer is notified to coordinate the qualification process.
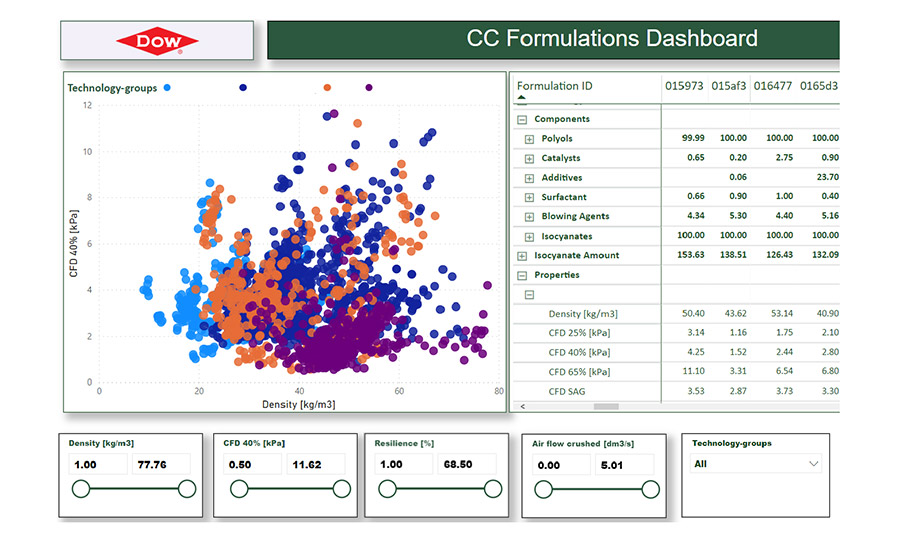
When a commercial formulation does not meet customer's KPIs, Dow scientist uses the Formulation Designer to search its library of experimental formulations. Figure 3 shows a screenshot of the visual search of experimental formulations for consumer comfort applications.
If an experimental formulation meets most customers' KPI, it may need to be further customized. The customization is done using the Predictive Intelligence (PI) models in the Formulation Designer. The PI models provide machine learning and science-based models to adjust formulation ingredients and quantities to predict polyurethane properties and vice versa. The formulations developed in this virtual lab are tested in Dow’s physical labs to validate models results. Still, it does provide a reliable starting formulation and cuts down the time to develop a new differentiated system. Dow’s Science-Based Artificial Intelligence Models are described in the following sections.
*Click the image for greater detail
Figure 3 - A visual search of formulation database.
The formulations developed in the virtual lab are validated at various scales to measure the desired properties while electronically collecting the data. These parameters are used to process information from the customer to understand the potential impact of its process conditions on the final properties of the polyurethane material. The new formulation and properties are saved in the database to enhance Dow’s predictive capabilities.
Dow developed several math-based models that consider molecular interaction and engineering heat and mass balances to accomplish this goal. Dow's foam flow model considers nucleation of bubbles and the flow of bubbles and the effect of time-temperature history on kinetics, bubble nucleation, and bubble growth processes3. Its math models can also predict the viscosity of prepolymers2, the kinetics and rheology of the formulation. This information allows the machine learning models to predict pot life, tack-free time, green strength time, and other properties under customer process conditions.
In summary, the framework of Predictive Intelligence was designed with a "bottoms up" approach to cover each aspect of product innovation. The main objective is to speed up the development of new products in Dow's laboratories and customer development processes. The goal is to be successful at the very first customer trial.
In the following sections, the authors describe a few case studies on the use of Predictive Intelligence capabilities. Some of these studies were performed to support customer trials; others were conducted during the development process in Dow’s laboratories.
Fundamental Structure-Property Modeling for Rigid Foams
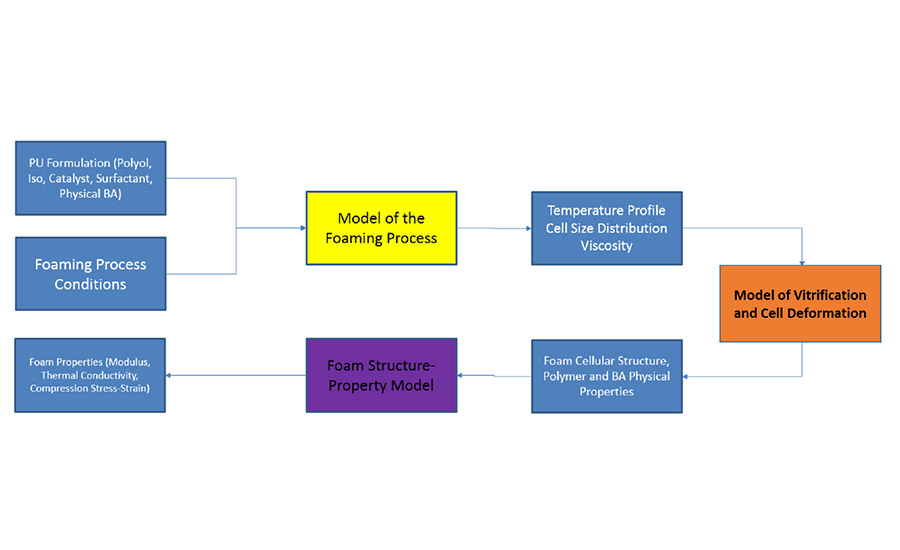
An example of a science-based predictive model that can consider different physical and chemical phenomena is shown in Figure 1. Science-based predictive models is a highly desired approach because it can accurately predict trends while requiring fewer data to develop machine learning models. However, developing science-based predictive models is a complex effort that requires connecting several predictors generated by sub-models6. A schematic of different submodels for rigid foams is shown in Figure 4. The Yale blue colored boxes indicate the input and output of sub-models.

*Click the image for greater detail
Figure 4 - Main ingredients of a formulation-structure property model for rigid PU foams.
The foaming process sub-model simulates nucleation and growth of bubbles and flow of foam and describes the structure of the foam (density, average cell size, cell size distribution, cell anisotropy, etc.) as a function of the foam formulation and processing conditions. The Vitrification and Cell Deformation sub-model then calculates the effect of the flow field and polymer properties on cell deformation. The predicted cellular structure, properties of the polymer, and cell gases enable the ML models to calculate the final foam properties under different process conditions. The user interface of the ML model allows formulators to tune the formulation parameters to meet required customer KPIs.
*Click the image for greater detail
Figure 5 - Schematics of the rigid PU foaming model. The yellow boxes indicate sub-models within the primary model, and the blue boxes describe the measurable inputs and outputs. The output of the foaming model (polymer modulus, viscoelasticity, and cell size distribution) is used as an input to the next model in the overall scheme.
The polyurethane foaming process itself is very complex. Figure 5 shows a schematic of various types of sub-models developed at Dow. The fundamental theories underpinning each of the yellow boxes are described in references7-11.
*Click the image for greater detail
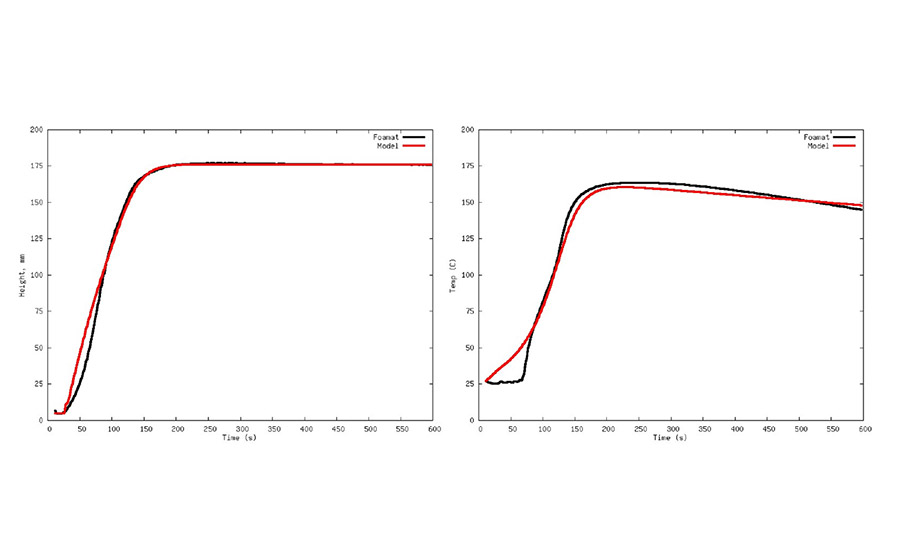
Figure 6 - Model (red) and data (black) for a representative rigid foam with cyclopentane (CP) blowing agent.
Figure 6 shows a comparison between the actual and predicted rise profile of two rigid-foam formulations
In summary, Dow has developed a multi-level model to relate the formulation and processing parameters to rigid polyurethane foams' structure and properties. The models' enhancement for a broader range of polyurethane applications is still in progress. However, the initial results indicate that a highly integrated physics-based model can be developed to describe various physical and chemical phenomena that machine learning algorithms can use.
Predicting the Mechanical Properties of Flexible Slabstock PU Foam Using Science-Based Machine Learning
The development of science-based models requires a deep understanding of the underlying principles that relate the input parameters to the output. Also, Dow has been exploring using Artificial Intelligence to correlate final properties to formulation and processing data. Artificial intelligence has found many applications such as data mining, data compression, pattern recognition, and face recognition4, 5, 13. However, its applications to material science have been limited14-16. Application of artificial intelligence algorithms such as neural networks to material science properties without knowing their limitations and distinct data qualities can result in erroneous trends17. Researchers have started using science-based parameters to reduce the data required for training artificial intelligence models18,19.
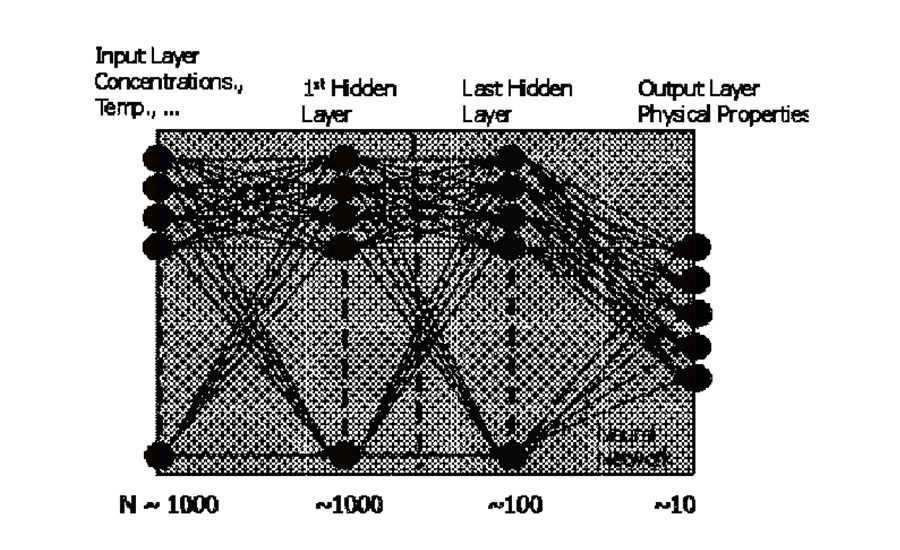
A conventional neural network algorithm would take the formulation components and processing parameters as the input layer. It will calculate one or more physical properties as the output layer through one or more hidden layers. A schematic of convention neural networks is shown in Figure 7. The model's training involves adjusting the weights or parameters that connect a neuron in one layer to all the neurons in the previous layer. A detailed discussion on neural networks is given elsewhere4, 13.
*Click the image for greater detail
Figure 7 - Schematic of neural networks.
Training machine learning models from thousands of ingredients and hundreds of performance requirements will require millions of formulations and their properties for each application. However, such a vast amount of data is not currently available. Researchers have reported that machine-learning predictions and trends will be erroneous in the absence of sufficient data17.
The science-based neural network concept is based on the theory of guided neural networks reported earlier18, 19. A schematic of one of Dow's science-based neural networks is shown in Figure 8.

*Click the image for greater detail
Figure 8 - A schematic of science-based neural networks.
Understanding chemical, physical, and polymer network properties is important in determining the final polyurethane properties, and to convert formulation to descriptors. The descriptors are used as input layers into conventional neural network algorithm.
The traditional neural network's output can also be used as input parameters to science-based correlations that describe the observed trends. The formulation descriptors reduce the number of input neurons by one order of magnitude and the formulation data required by two. Using a physics-based transformation equation at the end of the network helps to improve the accuracy of the predicted trends. An example of suitable physics-based equations is discussed by Ginzburg et al1.
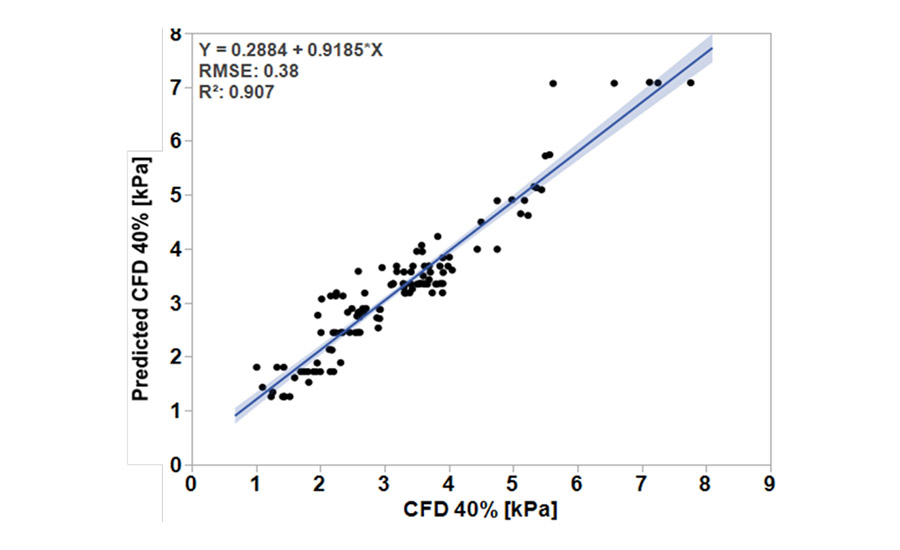
While the development of science-based neural networks is still ongoing, Dow has obtained good results. Using scientific descriptors, such as glass transition temperature and cohesive energy of hard and soft segments, Dow correlated various properties of flexible foams. Figure 9 compares predicted values of compression force needed for 40% deflection (CFD 40%) for flexible foams against the experimental values.
*Click the image for greater detail
Figure 9 - Predicted and experimental values of compression force at 40% (CFD 40%) deflection for flexible foams.
Processing of PU Coatings under Customer Process Conditions
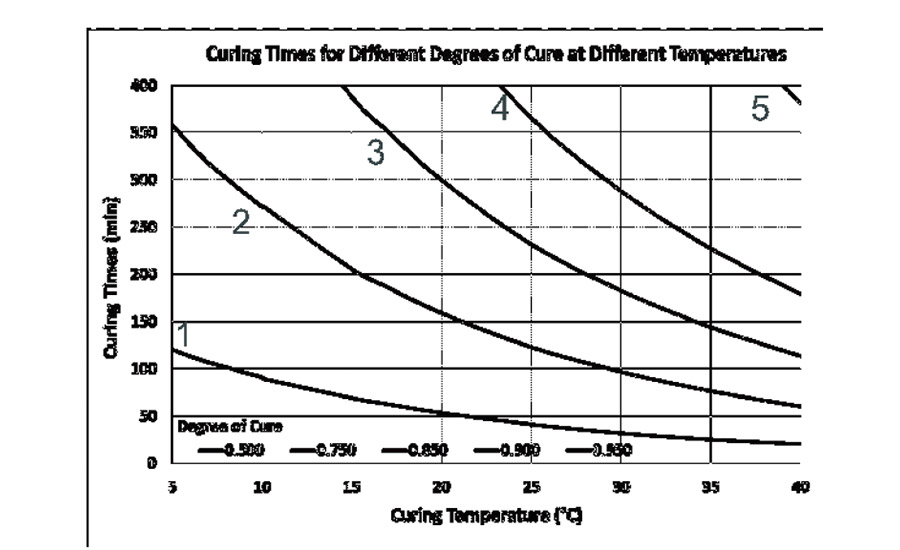
Another example of science-based models that machine-learning algorithms can use is in polyurethane elastomers. Elastomeric polyurethanes are used as adhesives, binders, coating, and sealants. In all these applications, formulators must achieve the desired properties and match processing characteristics. When the reactions evolve, pot life, tack-free time, and green strength time change at different rates depending on environmental conditions. Dow's math models combine kinetics, rheology, and coefficient of friction to predict the degree of cure over time at different temperatures2. In studies tailoring TRAFFIDECK™ Waterproofing and Anti-Slip Surfacing Systems, the coating materials were tested using ASTM C957. During the early stages of the development, a formulation showed promising properties under the standard ASTM testing conditions. The curing times at different temperatures were simulated as described in reference 2. Figure 10 shows the curing times to achieve 0.5, 0.75, 0.85, and 0.95 degrees of cure as a function of temperature. As shown by curve 5, it will take longer for the topcoat to achieve 0.95 degrees of cure at temperatures below 40 ºC and achieve desired properties. As a result, the formulation was adjusted to ensure that it reached the targeted properties under lower temperature application conditions.
*Click the image for greater detail
Figure 10 - Curing times for an experimental formulation as a function of temperature for various degrees of cure. Curve 5 shows that the coating will take long time to cure to 95%
Enhanced Flow Simulations to Improve Mold Fill
Another element of Dow's digitalization strategy is developing and applying high-performance computing (HPC) fundamental engineering models. Dow has a long history of creating and using comprehensive models built on computational fluid dynamics (CFD) platforms20. Previously, Dow partnered with an external software vendor to create a mold filling simulation tool21 that could evaluate injector and venting design on the formation of voids. Recently, Dow has shifted focus to developing an internal code to model additional aspects of the expansion and flow of polyurethane foam in open and closed molds. A detailed description of the DoFF (Dow Foam Flow) model can be found elsewhere22. The motivations for this internal software development include the ability to implement additional mechanistic models for nucleation and other phenomena into the simulation and the ability to distribute the capability to a broader user base widely.
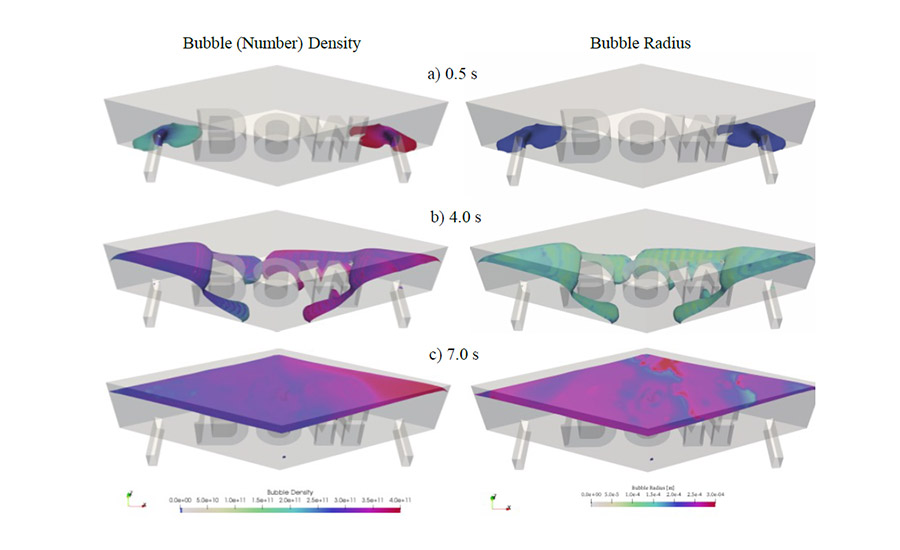
Figure 11 depicts some of the capabilities of this tool. The vertical frames in the figure show the foam shape (colored by bubble properties) at different times. The left column gives the bubble density (number of bubbles per unit volume) and the right column predicts the average bubble size. Two inlets are placed in this moderately complex mold geometry. The left inlet injects an isocyanate/polyol mixture with a lower amount of initial bubble nucleation. The sequence of time frames showing the effect of injected fluid differences on the foam growth and flow.
*Click the image for greater detail
Figure 11 - The evolution of bubble number density (left plots) and bubble radius (right plots).
The DoFF model has grown both in the application space, and additional modeling options continue to be added. Figure 12 demonstrates the application of the tool to a dynamic reference frame problem.
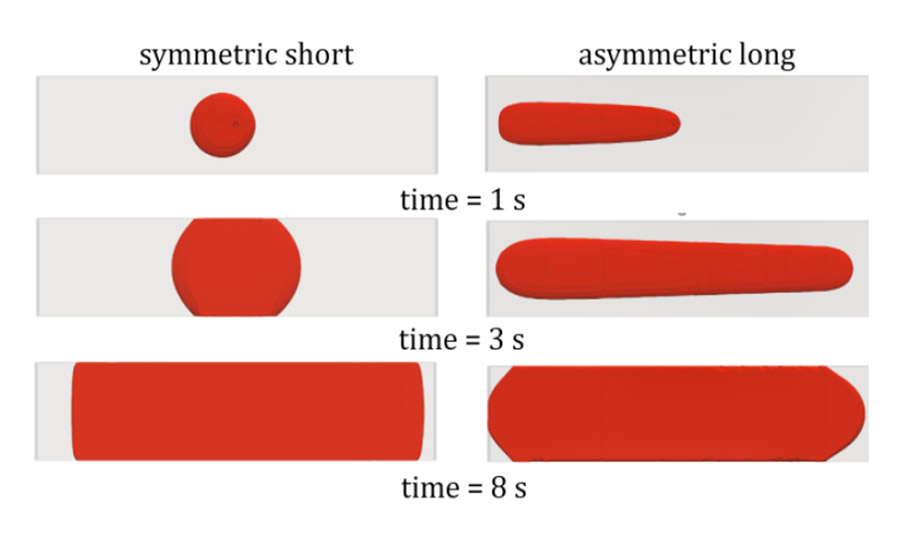
In this figure, two open mold designs are compared. In both cases, there is dynamic motion between the injector and the mold. This means either the injector moves over a stationary mold or a stationary injector feeds material onto a moving surface. The objective is to create a part with uniform properties. Due to the dynamic nature of the evolution of the polyurethane foam, it was necessary to impact an asymmetric motion of the system to produce a more symmetric distribution of the foam.
*Click the image for greater detail
Figure 12 - Comparison of injector dynamics on an open mold panel fill.
Once again, the columns in the figure represent different time steps, and the two columns depict different injection dynamics. On the left, there is asymmetric motion with a relatively small movement in the left to the right direction. On the right, an asymmetric faster left-to-right motion is used. The second design creates a part that has a more uniform distribution of the foam. This example illustrates the importance of the evolving fluid properties (due to viscosity changes) on industrial-scale foams.
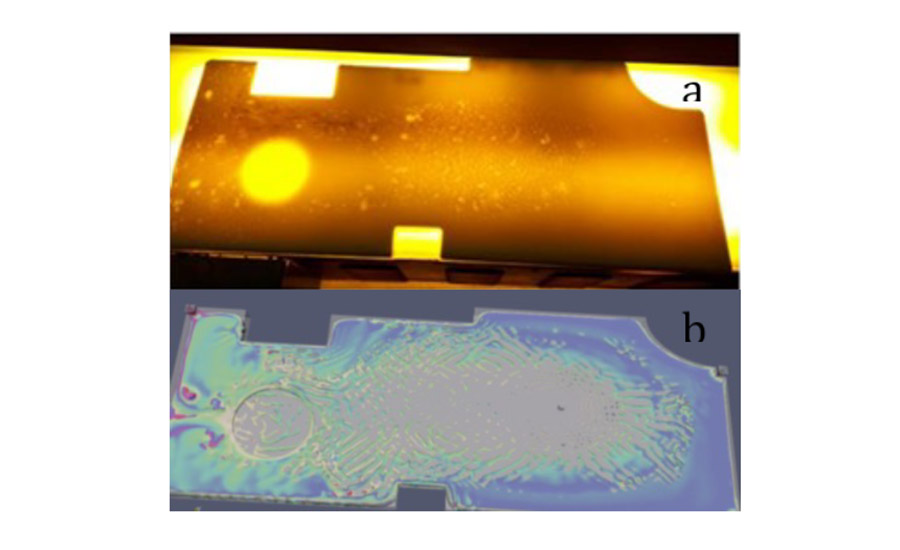
Understanding and reducing foam surface defects is another recent DoFF application. The undesired formation of blisters or uneven foam density regions can occur in some large molded parts. Figure 13 shows an example of this phenomenon. Figure 13a shows a foam that has been placed on a light source. The smaller irregular shaped brighter regions show several foam defects. Figure 13b shows a simulation of the same mold. The interaction of the foam surface with the mold surfaces is shown by the depiction of the free surface between the liquid and gas phases. In this plot, the surface is colored by temperature. These simulations are used to evaluate the effect of formulation changes and mold filling techniques (injector and venting number and location) on the foam surface. New opportunities continue to appear in assessing model accuracy and capabilities, which in turn stimulates further model improvements.
*Click the image for greater detail
Figure 13 -- Comparison of experimental and numerical results on surface defects.
Conclusion
While the journey is by no means complete, we have made notable progress in embedding digitalization in every aspect of product innovation. Dow Predictive Intelligence is a software suite developed specifically for researchers and business developers. It leverages historical data, math models, simulated customer processes into science-based artificial intelligence. Dow Predictive Intelligence is at the core of Dow Polyurethane's digital transformation strategy to achieve higher efficiencies and more innovation to deliver differentiated options. Predictive Intelligence supports Dow Polyurethane to meet customer needs faster, enhancing employee and customer experiences.
Acknowledgement
Several subject matter experts have been involved in this effort. Total involvement of formulators and their direct input during the initial stages of development was highly productive. We like to especially thank R&D and commercial leadership—Alan Robinson, Will Koonce, David Parrillo, and Andre Argenton.
REFERENCES
1. Ginzburg, V., Bicerano, J., Christenson, C. P., and Schrock, A. K., "Theoretical Modeling of the Relationship between Young's Modulus and Formulation Variables for Segmented Polyurethanes," Journal of Polymer Science: Part B: Polymer Physics, Vol. 45, 2123–2135 (2007)
2. Aguirre, F., Shafi, A., Grzesiak, A., Ghirmazion, Y., "Expanding the Coating Formulators Toolbox by Using Chemo-Rheological Models," Polyurethane Technical Conference 2018, 178-190, (2018)
3. Gillis, P., Quan, Y., Chi-Wei, T, Khan, I., Shafi, A., Ginzburg, V., and Claracq, J., "Fundamental Polyurethanes Foam Flow Simulations using Bubble Nucleation and Growth Models," Polyurethane Technical Conference 2019, Oct.7-9, Orlando, FL, (2019).
4. S. A. Oke, "A literature review on artificial intelligence," IJIMS, pp 535 (2008).
5. N. Gupta, "A Literature Survey on Artificial Intelligence," IJERT, ICPCN - 2017 Conference Proceedings, (2017).
6. Grünbauer, H.J.M., Bicerano, J., Clavel, P., Daussin, R.D., De Vos, H.A., Elwell, M.J., Kawabata, H., Kramer, H., Latham, D.D., Martin, C.A. and Moore, S.E., 2004. Rigid polyurethane foams (pp. 253-310). Boca Raton, FL: CRC Press.
7. Baser, S.A. and Khakhar, D.V., 1994. Modeling of the Dynamics of Water and R-11 blown polyurethane foam formation. Polymer Engineering & Science, 34(8), pp.642-649.
8. Ferkl, P., Karimi, M., Marchisio, D.L. and Kosek, J., 2016. Multi-scale modelling of expanding polyurethane foams: Coupling macro-and bubble-scales. Chemical Engineering Science, 148, pp.55-64.
9. Al-Moameri, H., Zhao, Y., Ghoreishi, R. and Suppes, G.J., 2016. Simulation blowing agent performance, cell morphology, and cell pressure in rigid polyurethane foams. Industrial & Engineering Chemistry Research, 55(8), pp.2336-2344.
10. Shafi, M.A., Joshi, K. and Flumerfelt, R.W., 1997. Bubble size distributions in freely expanded polymer foams. Chemical Engineering Science, 52(4), pp.635-644.
11. Khan, I., Adrian, D. and Costeux, S., 2015. A model to predict the cell density and cell size distribution in nanocellular foams. Chemical Engineering Science, 138, pp.634-645.
12. Kim, Y., Park, C.B., Chen, P. and Thompson, R.B., 2011. Origins of the failure of classical nucleation theory for nanocellular polymer foams. Soft Matter, 7(16), pp.7351-7358.
13. M. Nielsen, "Neural Networks and Deep Learning", online book http://neuralnetworksanddeeplearning.com
14. Gómez, F., Bruce, W., "Digital Transformation Initiative: Chemistry and Advanced Materials Industry, White Paper," World Economic Forum, Geneva, Switzerland (2019).
15. Bharadwaj, R., "Machine Learning in the Chemical Industry – BASF, DOW, Royal Dutch Shell, and More," Emerj: The AI Research and Advisory Company, https://emerj.com/ai-sector-overviews/machine-learningchemical-industry-basf-dow-shell/, November 22, (2019).
16. B. G. Sumpter and D. W. Noid, "NEURAL NETWORKS AS TOOLS FOR PREDICTING MATERIALS PROPERTIES," ANTEC, pp 2557, (1997).
17. P. Gosh, "AAAS: Machine learning 'causing science crisis'," A news report on American Association for the Advancement of Science in Washington, 16 Feb 2019, https://www.bbc.com/news/science-environment-47267081?intlink_from_url=https://www.bbc.com/news/topics/ce3k4x45wpmt/aaas-meeting&link_loc… 2/
18. N. Wagner and J. M. Rondinelli, "Theory-guided Machine learning in Materials science, Frontiers in Materials Vol. 3, Article 28, June 2016
19. A. Karpatne et.al., "Theory-guided Data Science: A New Paradigm for Scientific Discovery from Data," IEEE Transactions on Knowledge and Data Engineering, 29(10), pp.2318-2331, (2017).
20. D. Mao, J. R. Edwards, A. D. Harvey and L. A. Hebert, "Prediction of foam growth and its nucleation in free and limited expansion," Chemical Engineering and Science, vol. 61, no. 6, pp. 1836-1845, 2006.
21. G. Francois, "Multi criteria adaptive meshing for polymers processing in Rem3D®," 30th Polymer Processing Society, 2014.
22. P. Gillis, J. Claracq, I. Khan, C. Tsang and Q. Yuan, "Fundamental Polyurethanes Foam Flow Simulations Using Bubble Nucleation and Growth Models", PU Magazine, Vol. 17, No. 5, pp 196-203, October/November 2020.
This paper was presented at the 2021 Polyurethanes Technical Conference and is reproduced with permission from CPI and the American Chemistry Council.
Looking for a reprint of this article?
From high-res PDFs to custom plaques, order your copy today!


.webp?height=200&t=1704834340&width=200 "news-screens-GettyImages-165928833 (1).jpg")

