Understanding Carbonic Cleaning for Adhesive Bonding Applications
Bonding in automotive, aerospace, and other assembly operations can be improved through effective surface pretreatment technologies such as carbonic cleaning.
Cleaning and surface pretreatment are directly related in many industries. Traditional pretreatment methods such as alcohol wiping or air nozzles are used to clean off contaminants and prepare surfaces for adhesion. However, these cleaning techniques are not always effective, especially in bonding applications. They can leave contaminants on the surface that affect the bond strength between two materials.
What is Carbonic Cleaning?
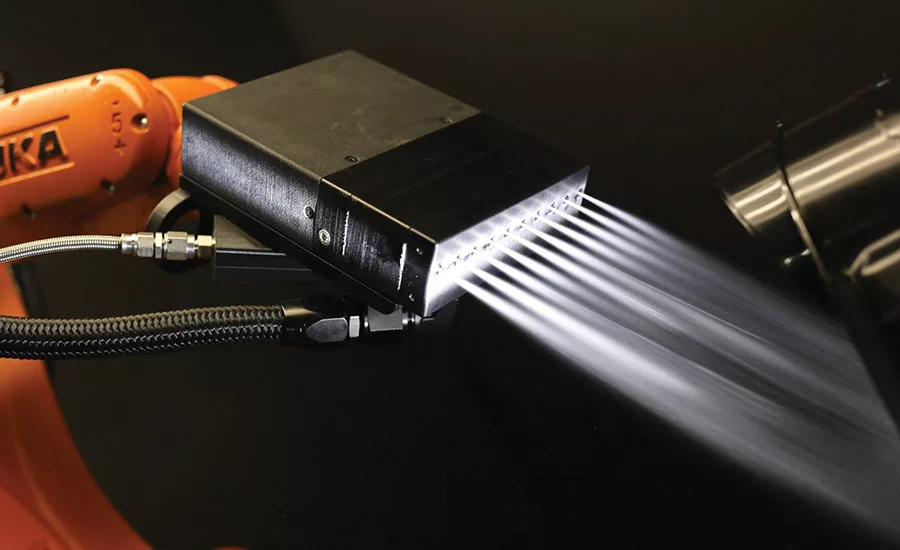
Carbonic cleaning is a surface pretreatment method that removes contaminants from any material without contact and is effective in efficiently and consistently preparing surfaces for adhesive bonding. Carbonic cleaning utilizes solid CO2 particles propelled by a temperature-controlled air stream. CO2 is inert, non-toxic, and non-flammable, making it a safe and versatile organic solvent. It is also non-aqueous and sublimes on any material it is cleaning, leaving behind only a clean surface.
Carbonic cleaning uses liquid CO2, which undergoes a sudden expansion; due to Joule Thomson’s theory, it lowers the temperature drastically, causing CO2 to go from a liquid to a solid state. These solid CO2 particles are propelled by a heated, compressed air stream. The air stream has two benefits in carbonic cleaning. It adds additional kinetic energy to the CO2 particles, which increases their velocity on impact with a material. It also raises the temperature of the CO2 particles, which changes their shape into sharp and pointed “bullet particles.” The fine points of these bullet particles allow CO2 to easily transfer kinetic energy to the surface of any material during collision.
Thermal strains due to the temperature of the CO2 also play a vital role in cleaning a surface, since CO2 stays solid for temperatures up to -78.5°C. The kinetic energy transferred, thermal strains, and solvent nature of solid CO2 particles weaken and break the bonds between the surface and contaminants, ensuring a clean surface.
Adhesives like epoxy are used to join two surfaces together using chemical bonding. They form strong bonds that take thousands of Newtons to break apart, but the strength of the epoxy is directly correlated to the surface area and cleanliness of the material. A larger surface area allows an epoxy to form more bonds between materials. Sanding is a common pretreatment before adhesion, since it increases the bonding surface area by changing the roughness without increasing the actual area of a material.
The cleanliness of a surface is important as well. Contaminants form weak bonds with the surface of the material, which reduces the surface area that an epoxy can bond with. With a lower surface area available for bonding due to contaminants, the force required to break apart two materials after an epoxy is applied decreases dramatically. Therefore, two clean surfaces that are joined together with epoxy take more force to break apart than two surfaces that are covered in contaminants.
Surface Preparation
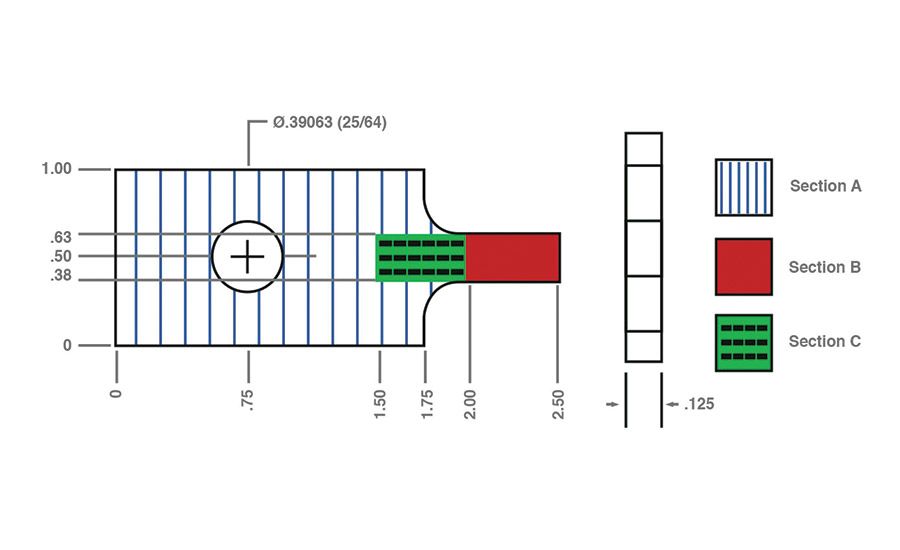
Experiments were conducted in triplicates using 6061 aluminum, black ABS, and 304 stainless steel. All materials were constructed with the same dimensions, in inches, as shown in Figure 1. The contact area of each sample (denoted by Section B in Figure 1) was sanded using 240 grit aluminum oxide sand paper. For 36 of the ABS samples, a contact area denoted by Section C in Figure 1 was also sanded.
A calibrator was used to mark 0.5 in. from the bottom of each material. This allowed all samples to have a consistent 0.5 x 0.25-in. surface area to apply epoxy to and bond to one another. For the 36 ABS samples that had Section C sanded, a calibrator was used to mark 1 in. from the bottom in addition to the 0.5-in. mark, so these samples had both Section B and Section C clearly marked.
The same procedure was used for conducting experiments on aluminum to aluminum, stainless steel to stainless steel, ABS to ABS, and aluminum to stainless steel. Eighteen samples of each material were collected. Nine samples had dry chalk dust (DeWalt-level 4) applied as the contaminant to replicate extreme cases of dust particles and dry debris, while the other nine had cutting fluid (TAP Magic) applied to replicate common oil contaminants.
Before applying dry chalk, masking tape was used to tape above the 0.5-in. mark to ensure that only Section B was exposed to the dry chalk. Once the dry chalk was evenly applied, the tape was removed, and the samples were ready to be cleaned. Cutting fluid did not need any masking tape before applying; only two drops of oil were evenly spread onto Section B, and then the samples were ready for cleaning.
All cleaning was done in a class 1,000 clean room to ensure that no additional contaminants would interfere with the experiment once the samples had been cleaned. Three samples for each contaminant underwent one of the three pretreatment methods: air, alcohol wipes, or carbonic cleaning. Air and carbonic cleaning were both propelled at 16.99 m3/h.
Once the samples were cleaned, masking tape was used to tape above the 0.5-in. mark so only Section B was available for all the samples. Epoxy adhesive was applied to Section B of only one of the samples that was joined together, while the other sample did not have any epoxy applied to Section B. Both samples overlapped their Section B, and a steel body and jaw 1-in. max opening spring clamp was used to clamp the samples together for 24 hrs so the epoxy could cure. Samples were not moved while curing to ensure the epoxy formed the strongest bonds between both surfaces. After each pretreatment, the epoxy was applied immediately after cleaning.
Since the epoxy forms a much stronger bond with metals than plastics, the procedure for aluminum to ABS and stainless steel to ABS experiments was slightly altered. When a metal and a plastic are joined using epoxy overlapping at Section B, the epoxy bond is stronger than the forces holding Section B to the rest of the plastic. This results in Section B breaking off the plastic before the epoxy breaks. To combat this, Section B of metallic materials must be bonded to Section C of ABS.
When preparing these samples, the metals were prepared the same as before, but ABS was treated differently. When applying dry chalk, masking tape was used to tape below the 0.5-in. mark and above the 1-in. mark. After the dry chalk was evenly applied to Section C, the samples were ready for cleaning. For cutting fluid, two drops of oil were evenly spread on Section C, and then the samples were ready for cleaning. After the samples were cleaned, ABS samples were taped below the 0.5-in. mark and above the 1-in. mark. Epoxy was applied to the metal on Section B and then aligned with Section C of ABS. The samples were clamped together for 24 hrs to allow them to cure.
Since there is masking tape above and below the surface area that is bonded together, only the force required to break the bonds between the materials was recorded. This is because the bonds between epoxy and masking tape and between the sample and masking tape are much weaker than the bonds between the two materials joined together with epoxy. When the force required to break apart the samples was recorded, it reflected the surface area of 0.5 x 0.25 in. between the two samples and discounted any epoxy that spilled into the masking tape.
Once the samples fully cured, they were placed in an ESM 1500 Mark-10 force tester. The force tester measured the force it took to break apart two materials, also known as the breaking force. The top and bottom of the apparatus have clevis pins that lock the samples in place while the force tester pulls the top sample away in a shear stress test, as shown in Figure 2.
Contaminant Removal Efficiency
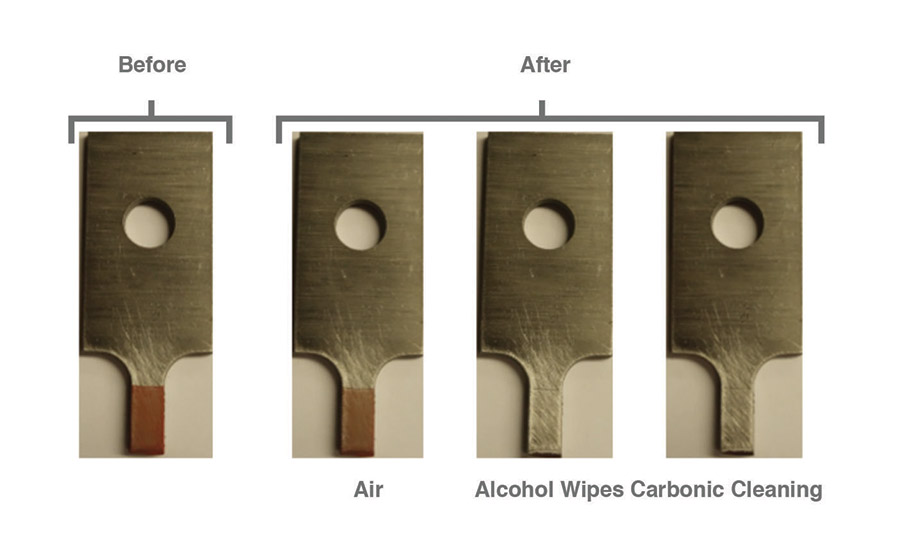
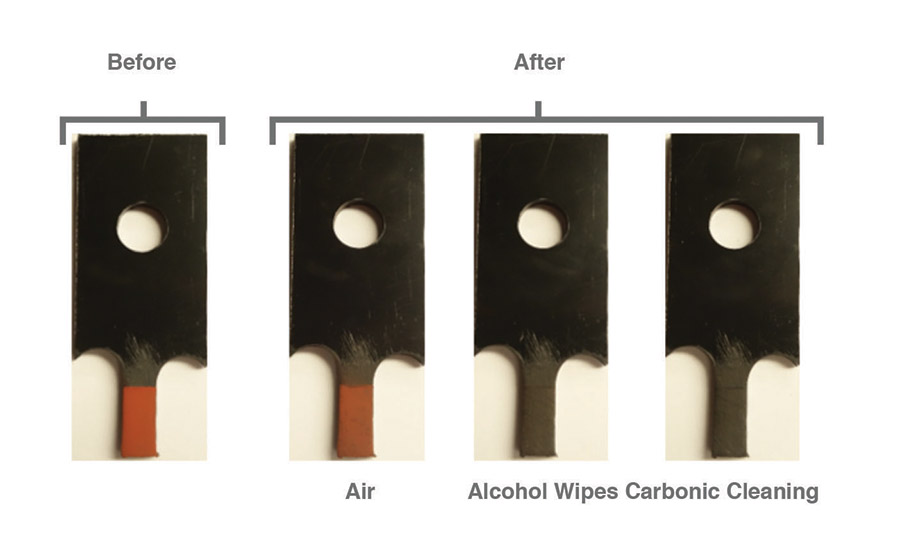
After pretreatments of air, alcohol wipes, and carbonic cleaning, dry chalk contaminants were visibly reduced for all pretreatments on all surfaces. However, only alcohol wipes and carbonic cleaning visibly removed most of the contaminants from the surface, while air left behind most of the dry chalk. Figures 3-5 show dry chalk contaminants on each material before and after all three pretreatments were applied.
Breaking Force and Pretreatment Correlation
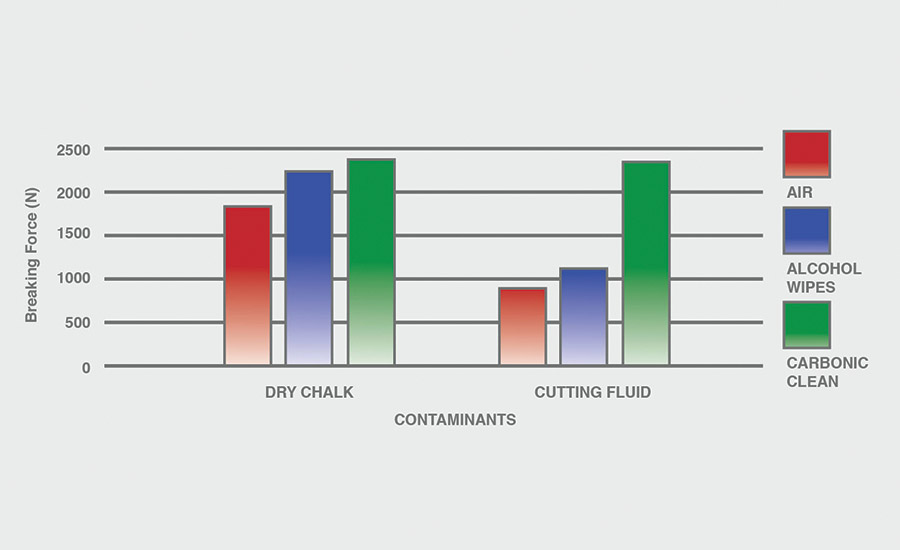
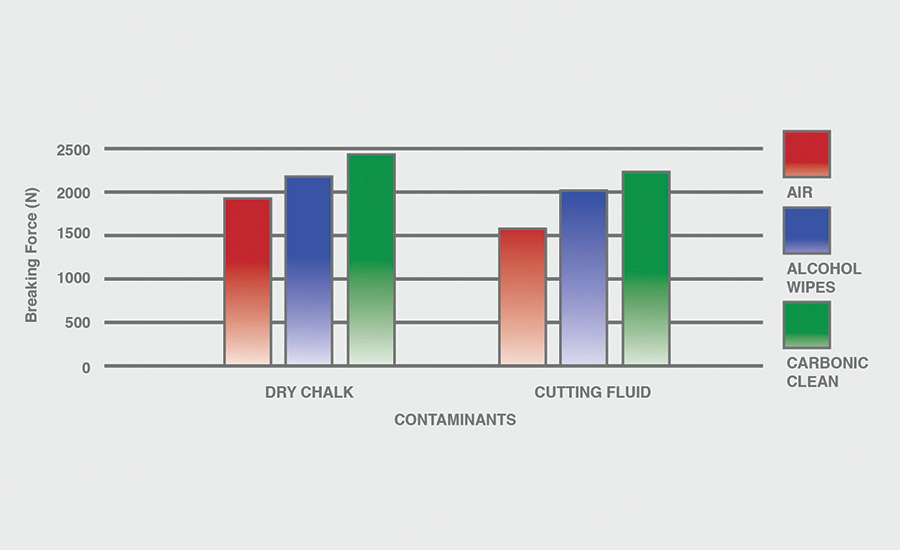
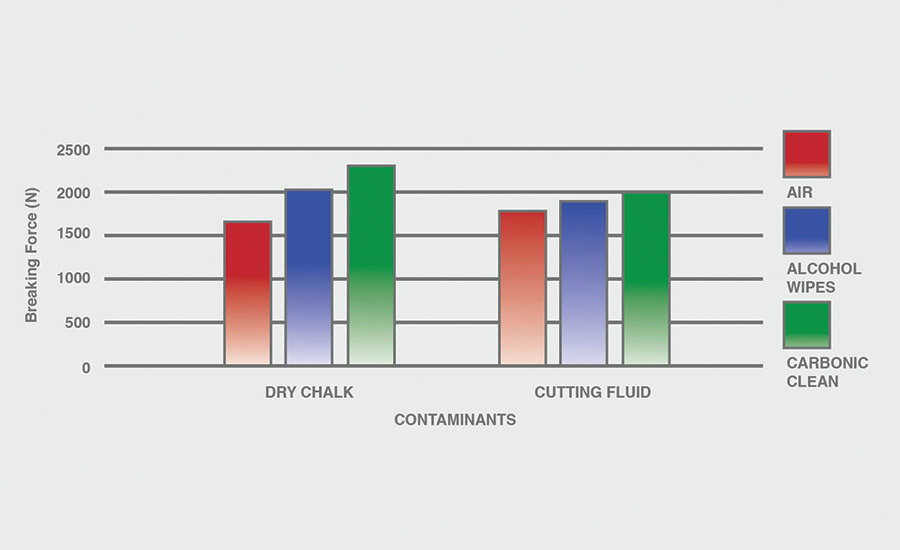
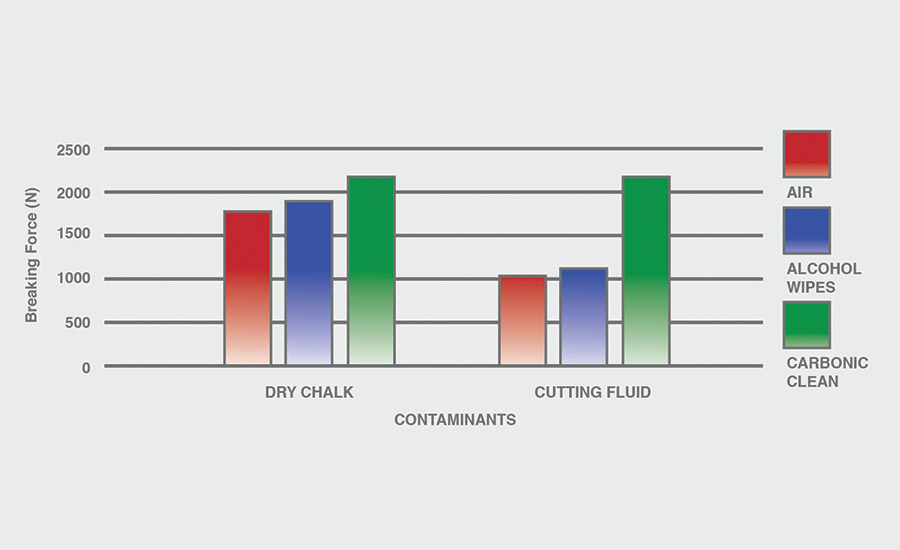
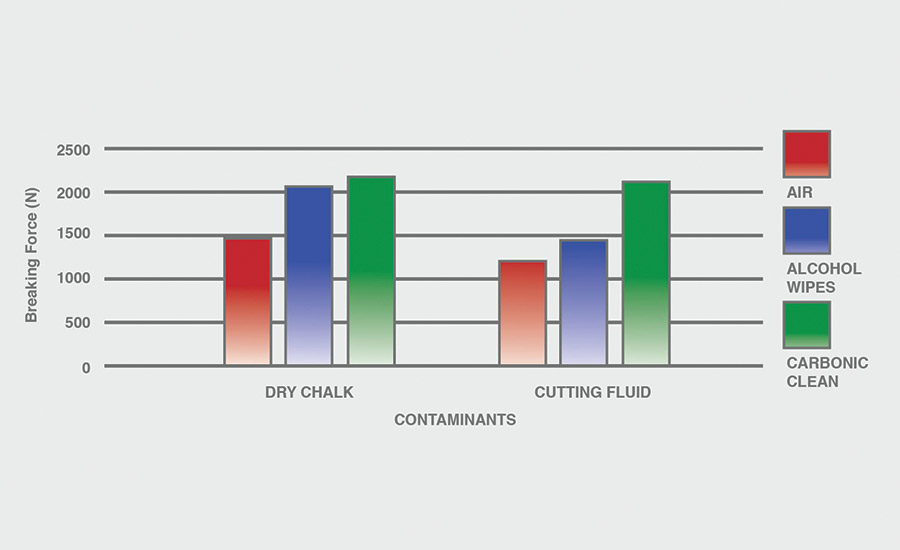
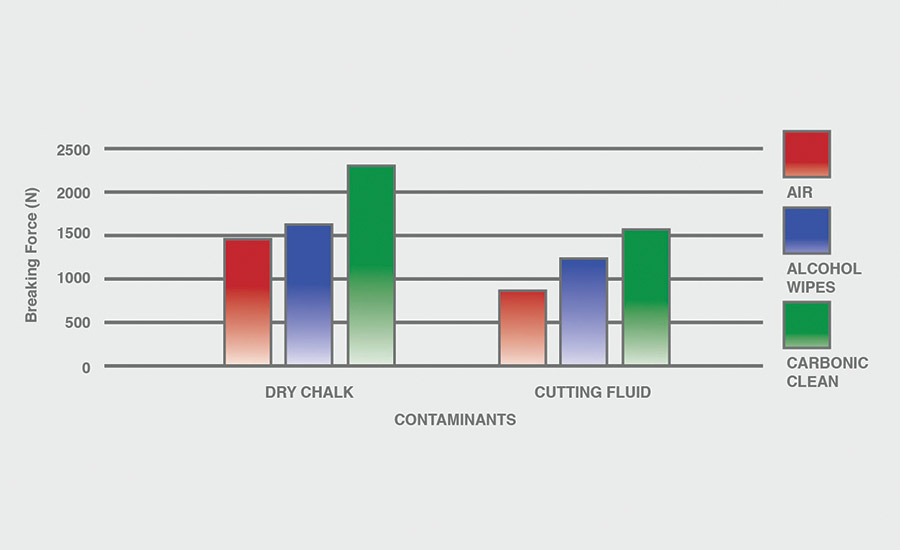
The breaking force (N) recorded for dry chalk and cutting fluid contaminants on all combinations of materials and pretreatments used were collected, and the data can be seen in Figures 6-11. All experiments had P-values under 0.05, signifying that all the data collected is statistically significant.
The results indicate that when samples were cleaned using carbonic cleaning, it took more force to break apart the two samples than when materials were cleaned with air or alcohol wipes for all materials and contaminants. Alcohol wipes recorded the second-most force to break apart the samples for all dry chalk and cutting fluid contaminants. Cutting fluid took less force to break apart than dry chalk for all materials and surface pretreatments, except for air on ABS-to-ABS surfaces.
Carbonic cleaning consistently had the highest breaking force, regardless of the materials or contaminants used. This indicates that after carbonic cleaning, common materials in industry such as 6061 aluminum, black ABS, and 304 stainless steel form stronger bonds when using an adhesive like epoxy compared to traditional cleaning methods such as air nozzles and alcohol wiping. As previously discussed, for a strong adhesive bond to be formed between two surfaces, the surfaces must be clean. This allows the adhesive to make strong bonds between only the two surfaces, with no other contaminant particles in between them.
Air visibly had the most contaminants left after cleaning, and this was reflected in the results. For all experiments, air required 32.0% less force (N) to break apart two surfaces after cleaning dry chalk and 74.9% less force to break apart two surfaces after cleaning cutting fluid when compared to carbonic cleaning. There is significantly less breaking force required for air than for alcohol wipes for both contaminants. Alcohol wipes required 14.1% less force to break apart two surfaces after cleaning dry chalk and 41.9% less force to break apart two surfaces after cleaning cutting fluid when compared to carbonic cleaning. Since contaminants remained after an air pretreatment, this resulted in drastically lower breaking forces compared to carbonic cleaning, which removed most of the contaminants from the surface.
The contaminant chosen directly affected the breaking force required for all materials and pretreatments. Removing cutting fluid resulted in a much lower breaking force than dry chalk for all materials when they were pretreated with air or alcohol wipes, but only a small decrease in breaking force when they were pretreated with carbonic cleaning. The breaking force (N) decreased 45.1% for air and 36.9% for alcohol wipes when the contaminant changed from dry chalk to cutting fluid for all experiments.
However, the breaking force for carbonic cleaning only decreased by 10.1% when the contaminant changed from dry chalk to cutting fluid for all experiments. This is an extreme difference between carbonic cleaning and traditional pretreatment methods. Regardless of whether the contaminant is dry or wet, carbonic cleaning cleans the surface and increases the breaking force consistently, while air and alcohol wipes decrease their cleaning and reduce their pretreatment effectiveness by 35-45% when switching from a dry to a wet contaminant.
Effective Alternative
After cleaning dry chalk and cutting fluid contaminants from 6061 aluminum, black ABS, and 304 stainless steel, carbonic cleaning was shown to be effective at cleaning contaminants off of a surface and increasing the breaking force after adhesion. All surfaces that experienced carbonic cleaning required the highest breaking force to pull apart the two samples for both dry chalk and cutting fluid contaminants when compared to air and alcohol wipes.
Carbonic cleaning was effective at cleaning both dry and wet contaminants off of surfaces, whereas air and alcohol had drastic differences in breaking force between the two contaminants. Carbonic cleaning has demonstrated its efficiency and consistency in cleaning a variety of common materials and contaminants in industry and is a proposed alternative method for surface preparation.
For additional information, contact the lead author at ahsan.anwar@reliabotics.com or visit www.reliabotics.com.
Authors’ Acknowledgements
This research was supported by Reliabotics Surface Technologies Group in collaboration with Cleanlogix and 3M. We thank our colleagues at Reliabotics and the chemical engineering department of Rutgers University, especially Alex Bertuccio, Ph.D., who provided insight and expertise that greatly assisted the research. We also thank the department of chemical and biochemical engineering at Rutgers University for their continued support.
Looking for a reprint of this article?
From high-res PDFs to custom plaques, order your copy today!


