STRATEGIC SOLUTIONS: 2011 Industry Outlook
In 2011, volatility has become the norm.
 In the wake of a crescendo of financial market concerns over a double-dip recession, hope tends to fade. Yet the current state of the industry does not reflect such concerns. Instead, expert analysis continues to support the outlook from last year, which stated that the industry would in fact experience slow protracted growth. The 2010 analysis included four factors that would influence 2011 performance:
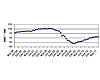
In addition to unemployment, the loss in asset value of homes, investments and cash flow further complicates consumer behavior. With discretionary income under severe pressure, the entire value chain is negatively affected. While there have been incremental improvements in 2010 and 2011, industrial production of goods is still well below 2007 levels (as seen in Figure 2).
Changes in the structure of the chemical industry’s approach to producing ethylene and propylene (the life sources for downstream markets like adhesives and sealants) have significant implications on the future of global supply and demand dynamics. Specifically, the price variance between oil and gas triggered a conversion of major fixed assets to lighter feedstocks based on shale gas. Cracking gas rather than naphtha significantly reduces the yield of higher molecular weight fractions (for example C5-C15), which are key to the growth of the adhesives and sealants industry.
During the recession, manufacturers have favored investments in emerging regions (primarily Asia), and structural capacity corrections have led to the logical consolidation of assets in North America and Europe. Nearly all of the major investments in Asia are based on naphtha feeds. Essentially, supply has chased demand to Asia; when coupled with the typically higher pricing in Asia, this phenomenon could translate to the makings of a perfect storm for North American markets.
The adhesives sector is forecast to grow 2.5% in volume, while sealants will gain volume marginally at rates of approximately 1.5%. The sealant market is highly influenced by the construction and automotive sectors; when combined, these sectors make up nearly 95% of sealant consumption. Although the auto industry showed modest gains, average vehicle sizes are declining. Meanwhile, the construction sector remains in a depressed state.
Revenue-wise, growth is predicted to stem from raw material pass-through and product mix changes toward higher valued chemistries. As a result, revenue growth is forecast in the range of 8-12% for 2011.
Natural rubber (NR): Another wet season led to poor crop yield this year. As a result, contract prices reached above $5,000/MT.
Butadiene (Bd): Global demand for tires, lighter feedstocks and supplementing NR shortages lead Bd to tight supply with prices exceeding $3,500/MT.
Isoprene (IP):Similar to Bd, tire production, lighter feedstocks and shortage of NR drove tightness in IP and price levels of $4,000/MT.
Piperylene (PIP) and Dicyclopentadiene (DCPD): As isoprene goes, so do PIPs and DCPDs as key byproducts. As a result, both are in periods of tightness due to lighter feedstocks and shortages of IP.
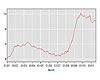
Figure 1. U.S. Unemployment Rate (Source: Bureau of Labor Statistics, U.S. Department of Labor)
- Slow demand
- Capacity utilization (end-market customers, as well as the manufacturing base of adhesives and sealants, would increase by less than 5%)
- Rising raw material costs
- Return to shortages of certain raw materials
Figure 2. Industrial Production Index (Source: U.S. Census Bureau)
Demand
Employment is a huge economic “x factor,” as consumers account for 70% of economic activity in the U.S (see Figure 1). The Federal Reserve indicates that U.S. unemployment will not move lower than 8.0% through 2013. In addition, it will be three to five years before there is any sustained economic growth and a “normal” job market.In addition to unemployment, the loss in asset value of homes, investments and cash flow further complicates consumer behavior. With discretionary income under severe pressure, the entire value chain is negatively affected. While there have been incremental improvements in 2010 and 2011, industrial production of goods is still well below 2007 levels (as seen in Figure 2).
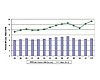
Figure 3. U.S. Adhesives Consumption Trends
Capacity Utilization
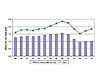
During the downturn, the Federal Reserve estimated capacity utilization dropped to historically low levels of 65%, causing structural changes to capacities in many industries. Current capacity utilization is operating near 75%, yet this is still well below the pre-recession levels of 83-85%. It is important to remember that significant capacity has been shuttered due to slow demand.Figure 4. U.S. Sealants Consumption Trends
Raw Material Shortages
Fundamentally, a couple of major factors continue to exacerbate raw materials challenges. These include lighter feedstocks, structural capacity corrections and competing demand from emerging regions.Changes in the structure of the chemical industry’s approach to producing ethylene and propylene (the life sources for downstream markets like adhesives and sealants) have significant implications on the future of global supply and demand dynamics. Specifically, the price variance between oil and gas triggered a conversion of major fixed assets to lighter feedstocks based on shale gas. Cracking gas rather than naphtha significantly reduces the yield of higher molecular weight fractions (for example C5-C15), which are key to the growth of the adhesives and sealants industry.
During the recession, manufacturers have favored investments in emerging regions (primarily Asia), and structural capacity corrections have led to the logical consolidation of assets in North America and Europe. Nearly all of the major investments in Asia are based on naphtha feeds. Essentially, supply has chased demand to Asia; when coupled with the typically higher pricing in Asia, this phenomenon could translate to the makings of a perfect storm for North American markets.
Growth Predictions
These dynamics framed the challenges faced by adhesive and sealant industry executives. Overall, modest growth is forecasted for 2011, but this growth is primarily being driven as a result of price contribution-passing through raw material increases-with fragile volume demand.The adhesives sector is forecast to grow 2.5% in volume, while sealants will gain volume marginally at rates of approximately 1.5%. The sealant market is highly influenced by the construction and automotive sectors; when combined, these sectors make up nearly 95% of sealant consumption. Although the auto industry showed modest gains, average vehicle sizes are declining. Meanwhile, the construction sector remains in a depressed state.
Revenue-wise, growth is predicted to stem from raw material pass-through and product mix changes toward higher valued chemistries. As a result, revenue growth is forecast in the range of 8-12% for 2011.
Summary
The industry’s fundamentals remain valid and continue to point to sustainable growth prospects. Macro trends reflect positive gains for the industry, including (but not limited to) several factors:- The drive for lightweight and fuel-efficient vehicles favors bonding, as the transportation industry engineers greater use of composites, plastics, and lightweight metal alloys to meet the new CAFE standards;
- Failing infrastructure drives civil engineers to contemplate greater use of polymeric/adhesive solutions to repair, remediate and strengthen concrete structures; and
- Packaging gains continue to be led by design efforts for “on-the-go” lifestyles, convenience, sustainable packaging and the five “easies”: easy to identify, easy to open, easy to replenish, easy to ship, and easy to dispose of.
SIDEBAR: Key Raw Materials
Acrylic acid (AA): Softer year-on-year acrylates demand and ample supply pushed market prices down as the industry overcame earlier tightness due to flooding along the Mississippi River.Natural rubber (NR): Another wet season led to poor crop yield this year. As a result, contract prices reached above $5,000/MT.
Butadiene (Bd): Global demand for tires, lighter feedstocks and supplementing NR shortages lead Bd to tight supply with prices exceeding $3,500/MT.
Isoprene (IP):Similar to Bd, tire production, lighter feedstocks and shortage of NR drove tightness in IP and price levels of $4,000/MT.
Piperylene (PIP) and Dicyclopentadiene (DCPD): As isoprene goes, so do PIPs and DCPDs as key byproducts. As a result, both are in periods of tightness due to lighter feedstocks and shortages of IP.
Links
Looking for a reprint of this article?
From high-res PDFs to custom plaques, order your copy today!


